


A yield curve is a graphical representation that shows the relationship between interest rates (yields) and different maturities of debt securities, typically government bonds.
The shape of the yield curve provides insights into investor expectations about future interest rates, economic growth, and inflation.

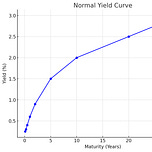
Normal Yield Curve (Upward Sloping):
Description: In a normal yield curve, longer-term bonds have higher yields than shorter ones. This upward slope reflects the higher risk and uncertainty of lending money over longer periods.
Economic Implication: A normal yield curve suggests that the economy is expected to grow, with potential inflation leading to higher interest rates in the future. Investors demand a premium for locking in their money for longer durations.

Inverted Yield Curve (Downward Sloping):
Description: An inverted yield curve occurs when short-term yields exceed long-term yields. This unusual situation means investors expect future interest rates to decline.
Economic Implication: An inverted yield curve is often considered a predictor of economic recession. It indicates that investors seek long-term securities due to concerns about the near-term economic outlook.

Flat Yield Curve:
Description: A flat yield curve shows that short-term and long-term yields are very close, resulting in a horizontal or nearly horizontal line.
Economic Implication: A flat curve may indicate economic transition or uncertainty. It can occur when the economy shifts from expansion to slowdown or vice versa, signaling investors are uncertain about future interest rates and economic growth.
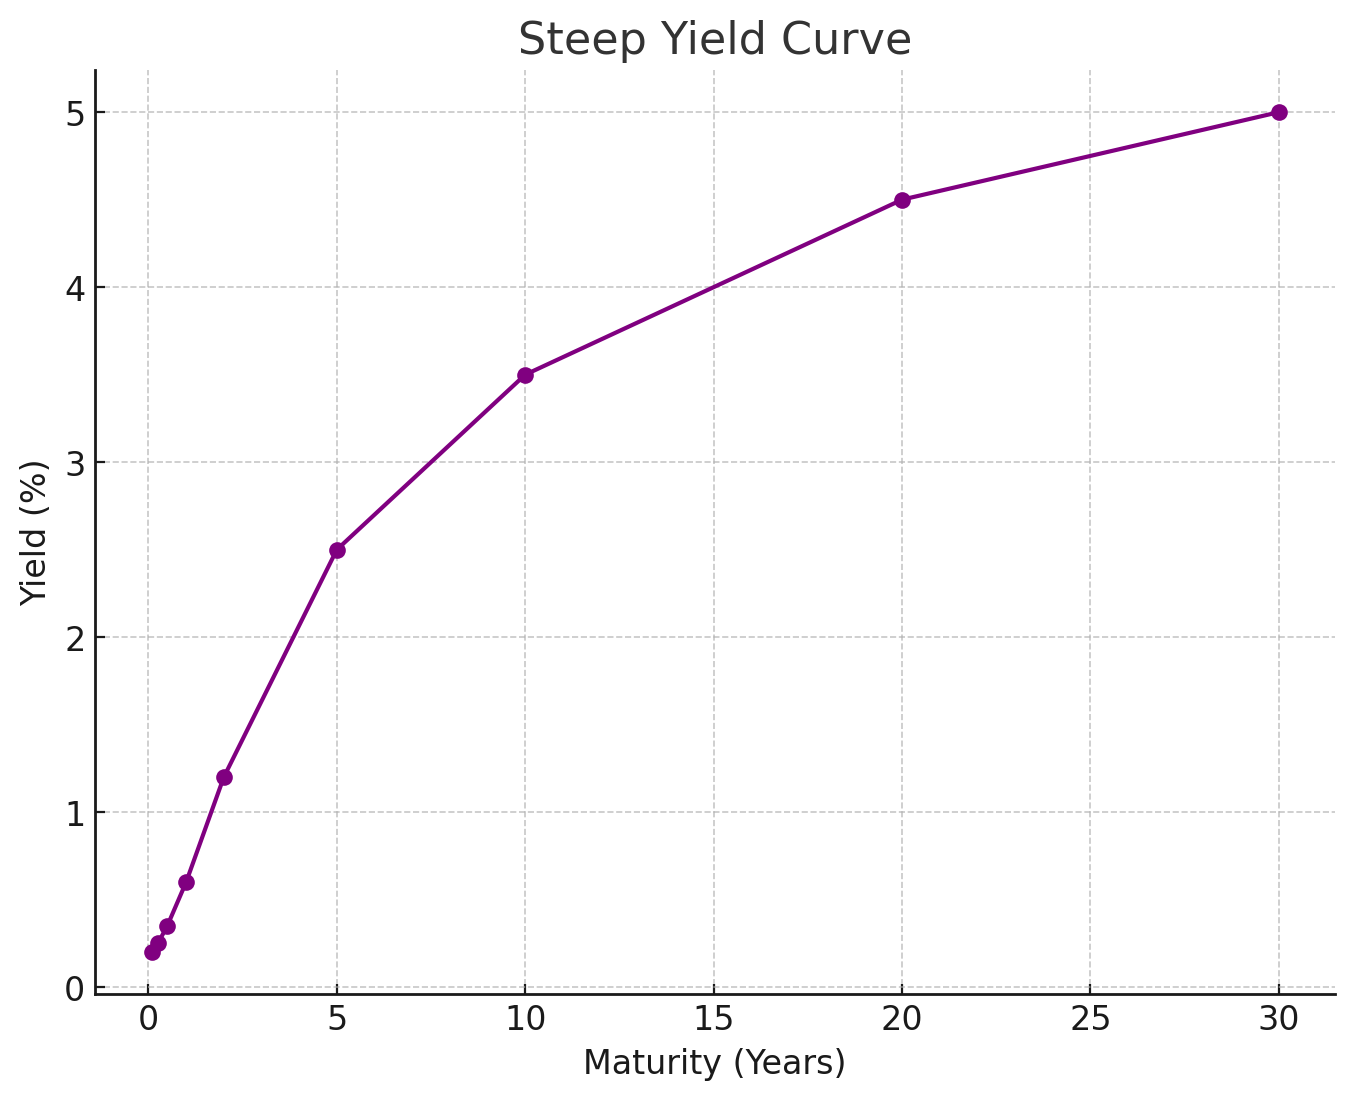
Steep Yield Curve:
Description: A steep yield curve is an exaggerated version of the normal curve, where the difference (spread) between short-term and long-term yields is larger than usual.
Economic Implication: This shape suggests strong expectations of rapid economic growth and potential increases in inflation and interest rates. Investors demand significantly higher yields for long-term investments to compensate for anticipated risks.

5. Humped Yield Curve (Bell-Shaped or Curved):
Description: A humped yield curve features higher yields for medium-term securities compared to both short-term and long-term securities. This results in a curve that rises and then falls, creating a hump.
Economic Implication: This uncommon curve shape may indicate that investors expect interest rates to rise initially and then fall in the long term. It reflects complex market dynamics and uncertainty about future economic conditions.

6. S-Shaped Yield Curve:
Description: An S-shaped curve combines elements of flat, normal, and inverted curves at different maturity ranges. It may start flat, become steep in the middle maturities, and flatten or invert at longer maturities.
Economic Implication: An S-shaped curve indicates varying expectations for different time horizons, reflecting a mix of short-term uncertainty and long-term confidence or vice versa.
Interpreting the Curves
Normal Yield Curve:
Implication: Healthy economic outlook with expectations of growth and possible inflation.
Investor Behavior: Preference for higher yields on long-term investments due to risks over time.
Inverted Yield Curve:
Implication: Potential economic slowdown or recession expected.
Investor Behavior: Moving investments to long-term securities despite lower yields for safety.
Flat Yield Curve:
Implication: Uncertainty in the economy could precede a transition.
Investor Behavior: Similar yields make investors indifferent between short and long-term bonds.
Steep Yield Curve:
Implication: Expectations of rapid economic growth and higher future inflation.
Investor Behavior: Demand higher yields for long-term bonds to compensate for inflation risk.
Humped Yield Curve:
Implication: Complex market expectations, possibly anticipating short-term rate hikes followed by long-term declines.
Investor Behavior: Preference for medium-term bonds due to higher yields.
S-Shaped Yield Curve:
Implication: Mixed expectations: stable short-term rates, rising medium-term rates, and stable or declining long-term rates.
Investor Behavior: Strategies vary based on differing expectations across maturities.
Real Rates
Bond yields can vary significantly even when inflation rates are similar. The US period from 1995 to 1999 and 2003 to 2007 may serve as examples.
Inflation Rates
1995-1999: The average annual CPI inflation rate was around 2.5% to 3.0% during this period
2003-2007: The average annual CPI inflation rate was also around 2.5% to 3.0% during this period
Bond Yields
Long-Term Yields
1995-1999:
10-year Treasury Yield: Averaged around 6.5% to 7.0% during this period. For example, in 1999, the 10-year Treasury yield was approximately 5.98%
30-year Treasury Yield: Was around 7.0% to 7.5%. In 1999, it was about 8.00%
2003-2007:
10-year Treasury Yield: Averaged around 4.5% to 5.0%. For instance, in 2005, the 10-year Treasury yield was about 4.25%
30-year Treasury Yield: Was around 5.0% to 5.5%. In 2005, it was approximately 4.67%
Short-Term Yields
1995-1999:
1-year Treasury Yield: Averaged around 5.0% to 6.0%. For example, in 1999, the 1-year Treasury yield was about 4.66%
3-month Treasury Yield: Was around 4.5% to 5.5%. In 1999, it was approximately 4.41%
2003-2007:
1-year Treasury Yield: Averaged around 2.0% to 3.0%. For instance, in 2005, the 1-year Treasury yield was about 3.23%
3-month Treasury Yield: Was around 1.5% to 2.5%. In 2005, it was approximately 2.79%
Listen to this episode with a 7-day free trial
Subscribe to Closelooknet to listen to this post and get 7 days of free access to the full post archives.
