


(1) What's the buzz?
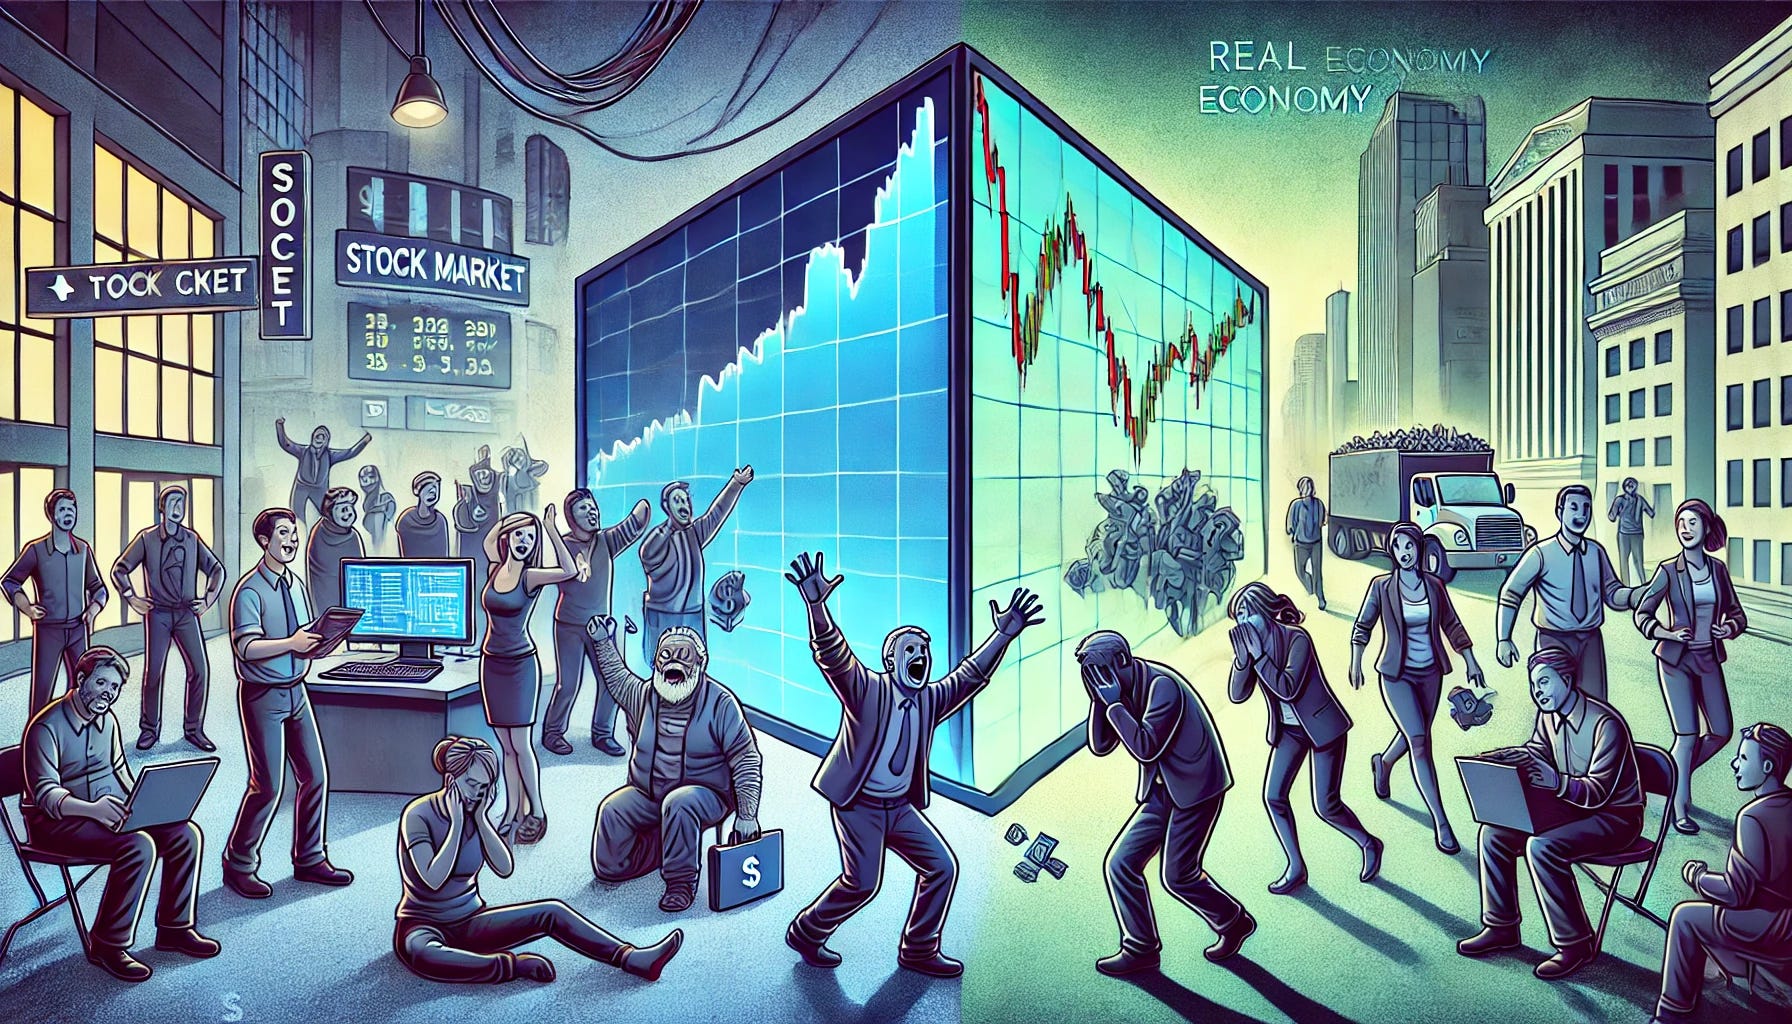
The stock market is disconnected from economic reality. Most of the time, and rightfully so! These claims may sound alarming, but the surprising truth is it's not a problem at all.
This disconnect is both structural and entirely sensible. Why? The answer lies in a fundamental principle: you don't invest in the economy but in the stock market. These are two distinct entities, each with its own set of rules and drivers.
The economy is the broad tapestry of our daily lives. It encompasses producing and consuming goods and services, employment rates, and economic growth. It's what we experience tangibly – the cost of groceries, job availability, and the general standard of living.
The stock market, however, is a different beast altogether. It represents the collective value of publicly traded companies, driven by a complex interplay of factors. Investor sentiment, future earnings expectations, and global market trends all play crucial roles.
(2) So what?
The stock market and the economy are not usually in alignment. The only times that the economy and the stock market coincide and align are when the stock market is trending.
At turning points, investors, waiting for confirmation from earnings and the economy, will lag behind the stock market, as history has proven that the stock market turns well before the economy.
Unlike the economy, the stock market is inherently forward-looking, often reflecting what investors believe will happen months or even years down the line rather than current economic conditions.
This forward-looking nature is vital to understanding why the stock market's disconnect from immediate economic reality is not only normal but often beneficial. It allows the market to price in future developments, act as a leading indicator, and provide opportunities for investors who can see beyond current economic circumstances.
(3) The Disconnect Decoded: Why Economic Models Fall Short in Financial Markets
Backing it up: The Efficient Market Hypothesis and applying economic models to the financial markets have proven unworkable.
“The Socionomic Theory of Finance” by Robert Prechter
In his seminal book "The Socionomic Theory of Finance," Robert Prechter articulated a compelling argument for treating the economy and the stock market as distinct entities.
Prechter posits that while the law of supply and demand governs rational valuations in the marketplace for utilitarian goods and services, financial markets operate under a different paradigm.
He states: "In finance, uncertainty about valuations by other homogeneous agents induces unconscious, non-rational herding, which follows endogenously regulated fluctuations in social mood, which in turn determine financial fluctuations. This dynamic produces non-mean reverting dynamism in financial markets, not equilibrium."
This perspective challenges the efficient market hypothesis (EMH), which has long been the foundation for fundamental analysis in financial markets. The EMH, an outgrowth of economic theory, has increasingly been recognized as an unworkable paradigm for financial markets.
The key to understanding this disconnect lies in one of the core assumptions of traditional economic theory: that all investors act rationally and with the same knowledge.
In the real world of financial markets, this assumption quickly breaks down. Investors have varying information and risk tolerances and are subject to various psychological biases and social influences.
These factors contribute to financial markets' complex, often unpredictable behavior that traditional economic models can't adequately explain. The stock market's frequent divergence from economic indicators is not a flaw but a reflection of its unique dynamics – a system driven by human psychology, expectations, and the collective interpretation of information about potential future outcomes.

Robert Prechter - The Elliott Wave Principle
The Elliott Wave Principle, developed by Ralph Nelson Elliott in the 1930s during his recovery, is a sophisticated technical analysis used to forecast market trends.
This method analyzes financial market cycles by identifying extremes in investor psychology, price highs and lows, and other collective factors. At its core, the Elliott Wave Theory posits that market movements are not random but follow a natural, fractal-like rhythm.
The basic pattern consists of five waves moving in the direction of the main trend (impulse waves), followed by three corrective waves (a "5-3" move). This pattern repeats at various scales, from minutes to centuries, creating a nested structure of market movements.
The theory incorporates specific rules and guidelines, such as the principle that Wave 2 never fully retraces Wave 1, and utilizes Fibonacci relationships to analyze wave structures.
Notably, the Elliott Wave Principle aims to reflect and predict market psychology, suggesting that investor sentiment oscillates between optimism and pessimism in a natural sequence, thereby creating identifiable patterns in price movements.
The Elliott Wave Theory has gained both adherents and critics in the financial world. Proponents argue that it provides valuable insights into market behavior and can accurately predict future price movements. They point to successful applications of the theory in various market conditions and timeframes. Critics contend that the theory is too subjective and has limited predictive power. They argue that the complexity of financial markets cannot be reduced to a single pattern-based approach and that the theory's effectiveness may be more due to a self-fulfilling prophecy than inherent market dynamics.
Mandelbrot's Market Insight: Why Economic Models Fail in Finance
Benoit Mandelbrot, renowned mathematician and pioneer of fractal geometry, made a compelling case for the distinct nature of financial markets. He asserted that applying economic models to these markets is fundamentally flawed:
"From the availability of the multifractal alternative, it follows that, today, economics and finance must be sharply distinguished..."
This distinction becomes evident when we consider empirical observations. In traditional economic theory, rising prices typically lead to decreased demand.
However, we often witness the opposite in financial markets: rising prices frequently stimulate increased demand and nurture even more price increases, a phenomenon known as momentum or trend-following.
Despite this stark contrast, many investors continue to erroneously apply the same analytical paradigms to both - economic and financial environments. This misapplication can lead to significant misinterpretations and potentially costly investment decisions.
Recognizing that price is the ultimate reality in trading and investing is crucial.
With its real-time pricing mechanism, the stock market represents a tangible reality of its own. Therefore, if you adhere to theories or analyses that suggest the stock market is "disconnected from reality" or somehow "wrong," it may be time to reassess your perspective. Such beliefs could indicate that your understanding, not the market, is disconnected from reality.
Benoit Mandelbrot - Fractal Theory in Finance
Successful investing requires acknowledging the unique dynamics of financial markets and adapting our analytical approaches accordingly.
Benoit Mandelbrot, the renowned mathematician who pioneered fractal geometry, made significant contributions to economics, particularly in understanding stock market behavior. His innovative work challenged traditional financial theories and introduced new perspectives based on fractal geometry and complexity science.
Mandelbrot's essential contribution was questioning the Efficient Market Hypothesis (EMH), a cornerstone of traditional financial models. The EMH assumes that price movements in the stock market are random and follow a normal distribution. Mandelbrot argued against this notion, demonstrating that market prices do not adhere to a Gaussian distribution but are instead far more volatile and unpredictable.
In response to these observations, Mandelbrot introduced the Fractal Market Hypothesis. This theory posits that financial markets exhibit self-similarity and scaling properties, mirroring natural fractal patterns. According to this hypothesis, market behavior can appear similar across different time scales, challenging the conventional understanding of market dynamics.

Mandelbrot emphasized the "heavy/fat tails" concept in stock market price distributions. This statistical property suggests that extreme values, such as sudden and significant price fluctuations, occur more frequently than predicted by a normal distribution. He termed this phenomenon "wild randomness," contrasting it with the "mild randomness" assumed in standard financial theories.
Furthermore, Mandelbrot introduced the concept of multifractal time in financial modeling. This approach accounts for varying degrees of market volatility over time, challenging the traditional assumption of uniform time progression in financial models. This insight has led to more sophisticated models that better capture the complex nature of market movements.
Mandelbrot's work has profoundly impacted modern financial analysis, inspiring more nuanced models that attempt to account for irregular and fractal market behavior. While his theories have not replaced traditional financial models, they have supplemented them, offering alternative perspectives on market dynamics and risk assessment.
Mandelbrot's application of fractal theory to finance has provided a more realistic framework for understanding financial markets' complex and often chaotic behavior, challenging long-held assumptions and paving the way for more sophisticated financial modeling and risk management strategies.
Recognizing the stock market as a distinct entity with its own set of rules is not just insightful—it's essential for navigating the complex world of finance.
Jesse Livermore: “A prudent speculator never argues with the tape. Markets are never wrong. Opinions often are.”
Jesse Livermore, one of the most influential stock traders of the early 20th century, developed a trading philosophy that emphasized market trends and price action over fundamental analysis.
His famous quote: “A prudent speculator never argues with the tape. Markets are never wrong. Opinions often are," encapsulates his belief in following market movements rather than personal biases or external opinions. Critical aspects of Livermore's trading strategy included:
Price Action and Trend Following: Livermore pioneered price action and trends to guide trading decisions. He bought and sold stocks based on price movements and trends rather than relying on fundamental analysis or a company's intrinsic value.
Market Psychology: He emphasized understanding market psychology, believing that emotions like fear and greed were critical drivers of market movements. Livermore stressed the importance of mastering these emotions in oneself and understanding how they affected other market participants.
Money Management: Livermore advocated strict money management rules, emphasizing preserving capital and quickly cutting losses. He famously said, "The real money made in speculating has been in commitments showing in profit right from the start."
Market Patterns: He studied and recognized specific market patterns and formations, which he used to predict future price movements. Livermore was exceptionally skilled in identifying market tops and bottoms.
Leverage and Speculation: Livermore often used leverage to maximize his gains, a risky strategy that sometimes led to spectacular successes but also contributed to his financial ruin on multiple occasions.
Livermore's Rules: He developed a set of trading rules and principles based on his experiences, covering various aspects of trading, including when to buy and sell, how to manage risk and the importance of studying the market.
The Life and Legacy of Jesse Livermore
Born in 1877, Jesse Livermore became known as the "Boy Plunger" and the "Great Bear of Wall Street," gaining notoriety for his ability to make and lose vast fortunes through speculative trading.
Livermore's keen market insights and trading prowess were particularly evident during significant market events. During the Panic of 1907 and the stock market crash of 1929, he reportedly made millions by short-selling stocks, cementing his reputation as a skilled speculator.
Despite his remarkable successes, Livermore's life was marked by dramatic ups and downs. He declared bankruptcy multiple times throughout his career, with his final bankruptcy in 1934 being particularly devastating. Despite having once amassed a fortune of $100 million, Livermore ended his life in financial ruin, committing suicide in 1940.
Unlike later market analysts like Benoit Mandelbrot, who approached the market from a theoretical and mathematical standpoint, Livermore's contributions were based on his practical experiences as a trader. His methods and philosophies, rooted in intuition and psychological discipline, are still studied and admired by traders today.
Livermore's life and work have been immortalized in books like "Reminiscences of a Stock Operator," considered a classic in trading. His legacy lives on in the strategies and philosophies that many traders continue to use as a foundation for their approaches to the stock market.
Livermore's unique perspective, blending practical experience with psychological insight, continues to influence modern trading strategies, offering a counterpoint to more theoretical approaches to market analysis.
Real-world examples of the Elliott Wave Principle in action:
Bitcoin's 2017-2018 bull run and subsequent crash:
The dramatic rise of Bitcoin from under $1,000 to nearly $20,000 in 2017 followed a clear 5-wave impulse pattern. This was followed by a sharp 3-wave corrective decline in 2018, bringing the price back to around $3,000. This aligns well with the basic Elliott Wave structure of a 5-wave advance followed by a 3-wave correction.S&P 500 from 2009-2020:
The 2009 low to 2020 high bull market can be interpreted as a large 5-wave impulse pattern. Each of the 5 waves can be further subdivided into smaller 5-wave patterns, demonstrating the fractal nature of Elliott Waves. The COVID-19 crash in early 2020 then represented the start of a corrective wave.Gold prices 2001-2011:
The rise in gold prices from around $250 per ounce in 2001 to over $1,900 in 2011 can be seen as a textbook 5-wave Elliott Wave pattern. A multi-year corrective phase followed this.Dow Jones Industrial Average 1932-1937:
This period, which includes the recovery from the Great Depression, shows a clear 5-wave advance followed by a 3-wave correction, as described by R.N. Elliott himself in his original work.Japanese Yen vs US Dollar 2011-2015:
The decline of the Yen against the Dollar during this period followed a clear 5-wave Elliott pattern, with each wave showing the characteristic features described in the theory.

Share this post