


US Stocks: Riding the Wave to New Heights?
Could 2025 Mark the Third Year of a Thriving Bull Market?

Salve, cari subscripti!
Thank you for reading this week's edition of Closelook@US Stock Markets, dated November 24, 2024 👋. The next edition will be published on December 01, 2024.
A Closelook At This Edition
This Week's Action: Bull Awakening
US Economy: No Sign Of Long And Variable Lags Materializing
US Stock Market Seasonality: Riding the Bull in November, December, and January
Long-Term Analysis: Nasdaq 100, Semiconductors, Nvidia And More
This Week's Spotlight: My Favorite Cloud And Software Stocks
Knowledge Corner: How Do Long And Variable Lags Affect The Economy?
The Derivatives Portfolios: More Transactions
Final Words: Buffett Cash vs. Market Cycles

(1) This Week's Action: The Fading Trump Rally
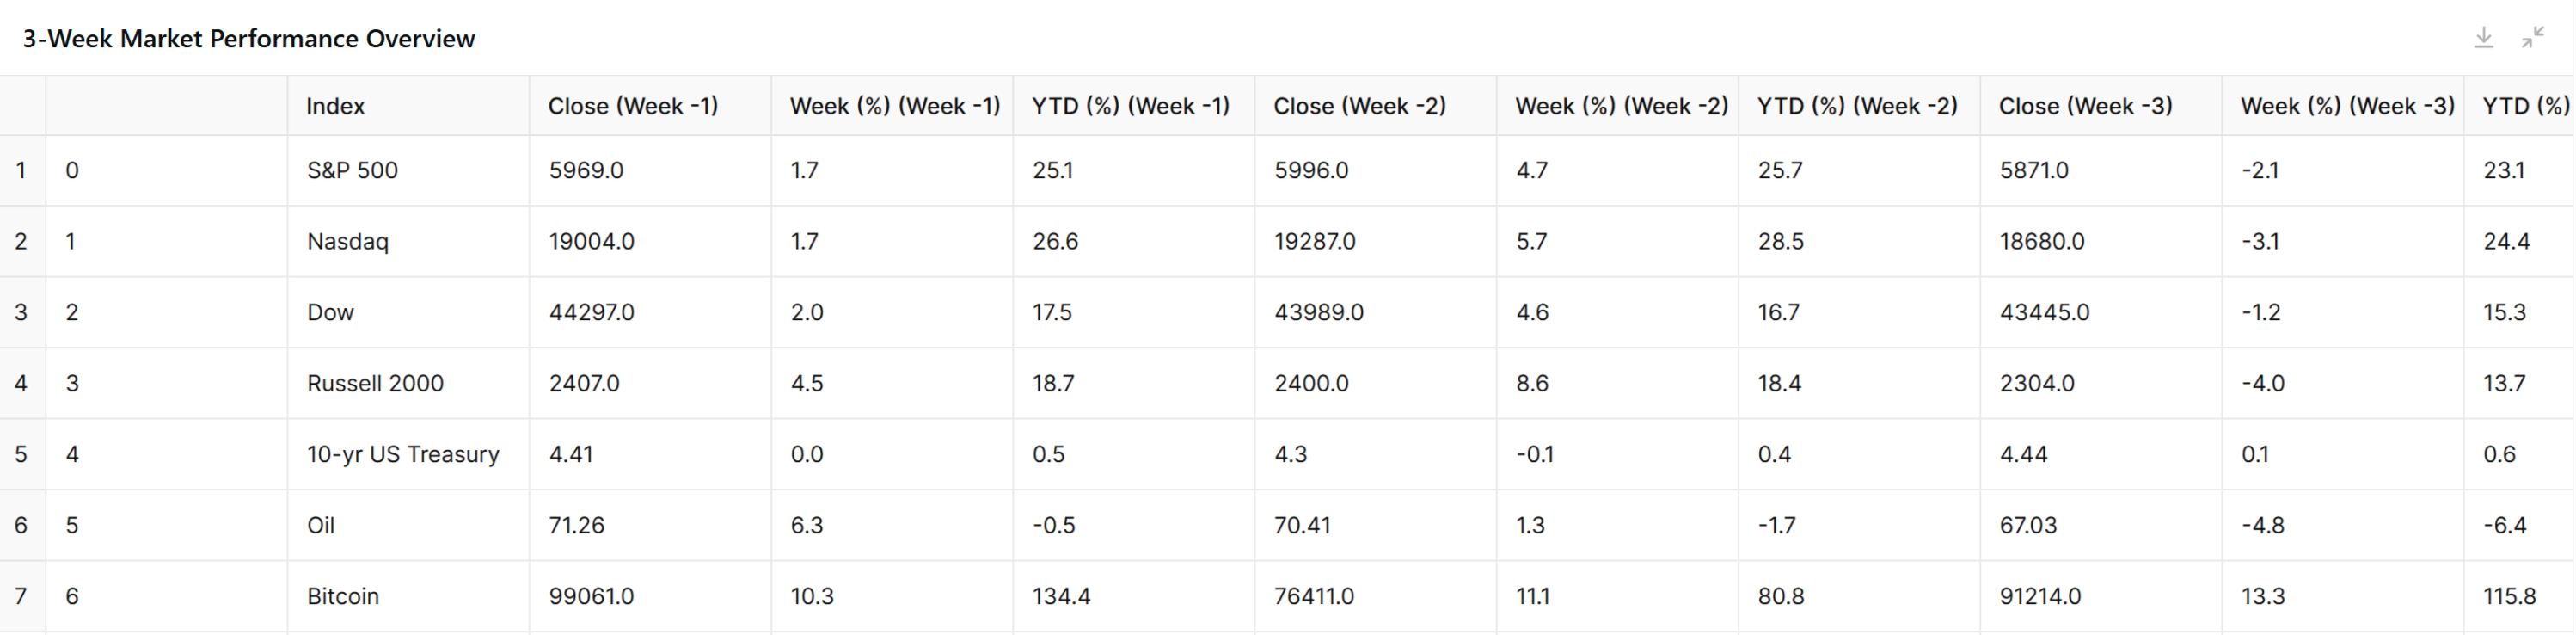
Last week was the opposite of the week before. The weekly performance of all US stock markets was outstanding.

Weekly Performance Summary
Stock Market Indices:
The S&P 500, Nasdaq, and Dow saw moderate weekly gains of +1.7%, +1.7%, and +2.0%, respectively.
Year-to-date (YTD), the Nasdaq is leading with +26.6%, followed by the S&P 500 (+25.1%) and the Dow (+17.5%).
Small-Cap Stocks:
The Russell 2000 exhibited the largest weekly gain at +4.5%, signaling strong performance in smaller-cap stocks.
Its YTD performance stands at +18.7%.
Bonds:
The 10-year US Treasury yield remained unchanged at 4.41% for the week, with a modest YTD increase of +0.5%.
Commodities:
Oil prices rose by +6.3% over the week, now at $71.26, but show a slight YTD decline of -0.5%.
Cryptocurrency:
Bitcoin surged by +10.3% this week, bringing its YTD increase to an extraordinary +134.4%.
The data highlights a broadly positive week for equities, particularly small-cap stocks, alongside notable gains in Bitcoin and oil. Treasury yields remain stable, reflecting minimal volatility in fixed-income markets.
The dollar continued its advance, too. Since the lows around the GFC, the currency has appreciated by nearly fifty percent.
I expect the US Dollar Index to rise to the 115 level shortly.

The bullish channel of the SP 500 is still intact. The same is true for the Nasdaq 100 index.

The Nasdaq 100 found support at the short-term bull market trendline and moved back to the summer 2024 highs.

The Nasdaq 100 qual Weight Index outperformed the Nasdaq 100 Index. Mag-7 weakness negatively impacted the latter.

The Nasdaq 100 Technology Index is still lagging the overall index. It is still considerably lower than the summer 2024 highs.

The Nasdaq 100 EX Tech Sector has outperformed the tech sector since the summer of 2024. It is very close to its ATH.

The Nasdaq 100 TOP 30 index has been among the worst performers of the various Nasdaq 100 subindices.
This shows that the weakness is not confined to the Mag 7 stocks but encompasses the top 30 Nasdaq 100 stocks.

The Nasdaq 100 ex Top 30 Index, which covers the other 70 stocks of the index, has outperformed the Nasdaq 100 and the Nasdaq Top 30 index since the summer of 2024. It is very close to its SATH, too.

The megacap tech weakness can also be seen in the performance of the US Top 20 index.

Once highflying, VanEck Semiconductor ETF reached a top in early July 2024. Since then, it has moved sideways.

The recently introduced fabless VanEck Semiconductor ETF (SMHX) has outperformed the broader SMH ETH.

I expect the Russel 2000 index to reach new ATHs shortly.

The same applies to the Dow Jones Industrial Average.

The Dow Jones Transportation Index was up 0,84 % for the week. It looks like it will soon reach new ATHs - way above the 2021 levels.
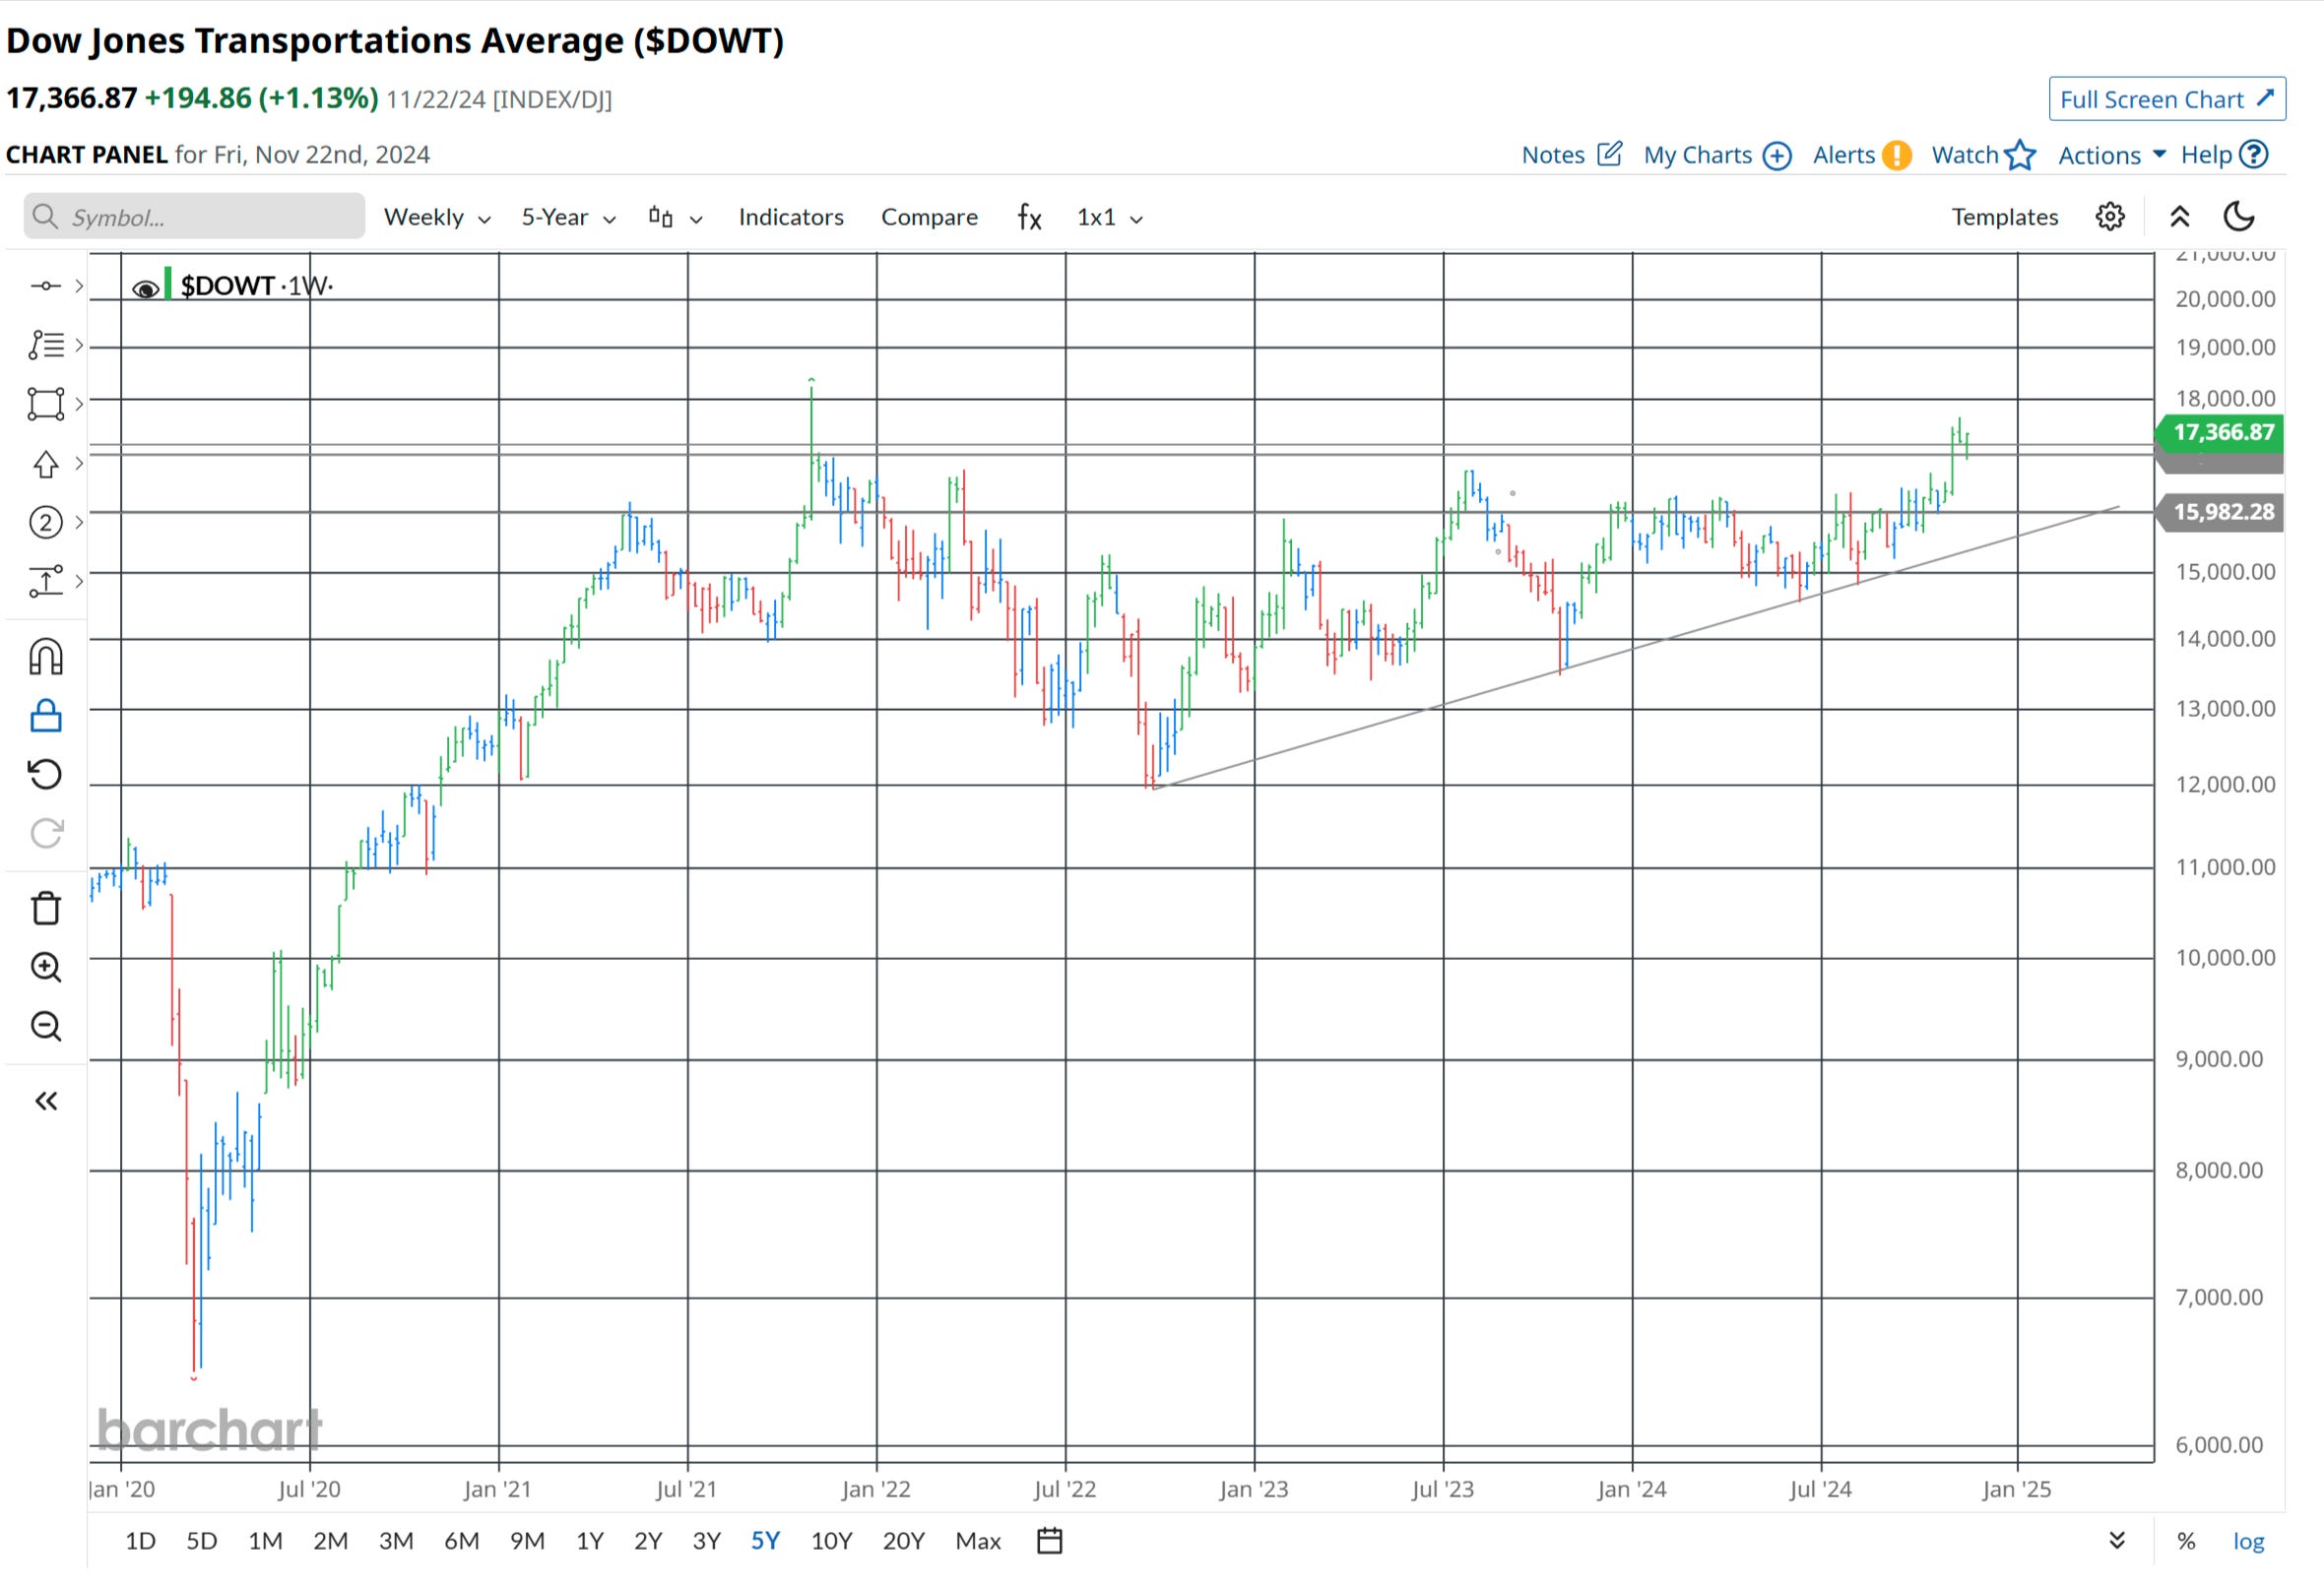
This would be quite a bullish divergence, which may signal a more than short-term continuation of the bull market.

Software and services have been among the strongest sectors in the past weeks. The chart above shows the performance of an ETF that tracks the S&P Software & Services Select Industry Index.
The index represents the software and services segment of the S&P Total Market Index ("S&P TMI").

The same applies to the cloud sector. The Wisdom Tree Cloud Computing ETF has moved from a low of 28 USD in the summer of 2024 to 38 USD. The Wisdom Tree Cybersecurity ETF shows a similar performance.

The SP 500 Info Tech sector has moved up considerably and is now very close to its ATH (see ETF below).
It looks like there is a particular weakness in some Mag 7 stocks, but there is no weakness in the second-tier stocks. The broadening theme can also be seen inside the tech sector.

Nvidia performed better than the bulk of semiconductor stocks. The bull trend is intact. I am a buyer of any dip. Blackwell has just started shipping. I expect an exceptional earnings print in April 2025.

Bond yields were flat on the week and stayed inside the 4.25 - 4.50 % yield range. The TLT ETF closed around 90 USD.

I expect bond vigilantes to stage another attempt to move the bond yield firmly above 4.50 % in the weeks ahead.
Ten-year US Treasury yield changes since September lows:
Total increase: 78 basis points
Composition:
Real rates: 68% of the increase
Inflation expectations: 32% of the increase
Equity market reaction:
Largely unaffected by the yield increase

The rise in yields, primarily driven by higher real rates, reflects ongoing economic strength rather than inflation concerns. This explains the resilient equity market performance despite the yield increase. Last week’s statement stays valid.
US presidents come and go, but this election may matter more than other ones. Why? Because there will be structural credit and deficit troubles ahead in the US, and how they are addressed will significantly impact whether we will have mediocre stock market returns in the next 10 years (the Goldman Sachs view) or (close to) double-digit annual returns (Ed Yardeni’s roaring 20s concept).
I anticipated a top in the TLT based on better-than-expected economic indicators rather than the beginning of another debt crisis like the one that occurred from August to October 2023.
I firmly believe that when the bond markets start to worry deeply about the federal deficit and debt and bond vigilantes push them south, moving prices of the TLT ETF to the bottom or even below its multi-month trading range, the stock market bull will end abruptly.

Like in 2016, gold declined on the Trump victory news. The uptrend in pace since the summer of 2024 was broken. Gold staged a recovery last week. I doubt it will reach new ATHs unless there is a substantial geopolitical escalation.

Silver exhibited similar price action and also moved lower. The trend in place since early 2024 has not yet been violated.
(2) US Economy: No Sign Of Long And Variable Lags Materializing
Entitlements have become a large share of total government spending. Previous budget agreements will cut non-defense discretionary spending to the lowest share of GDP on record.
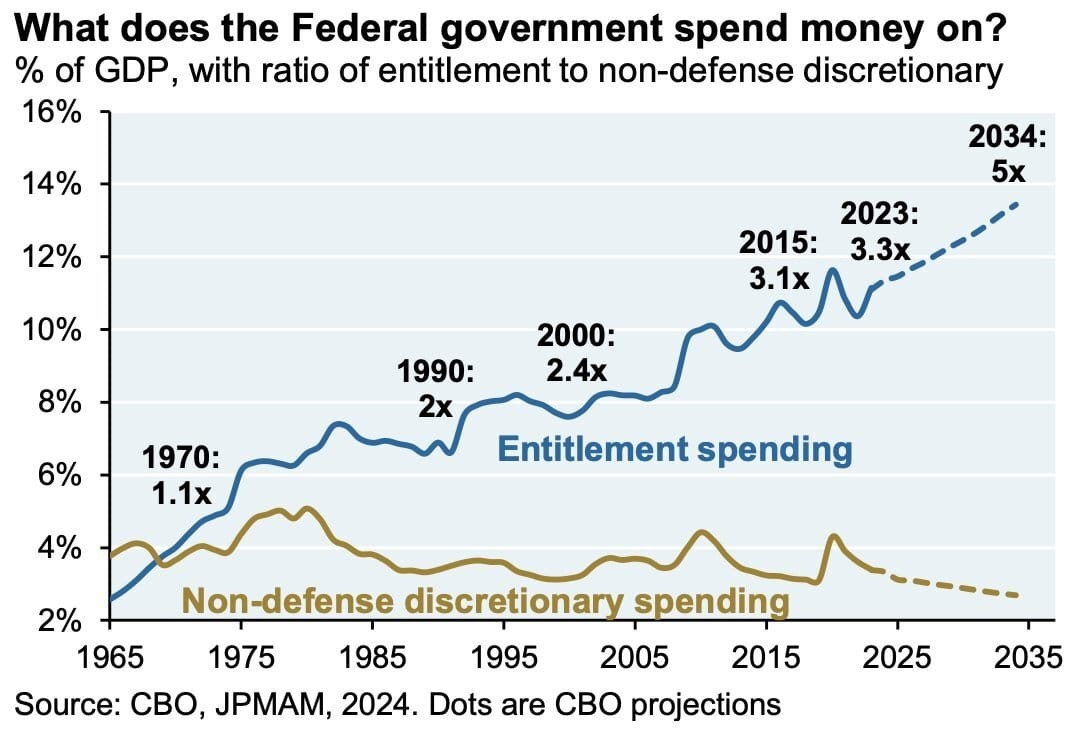
As for DOGE, good luck with that endeavor.
The latest jobless claims data presented a mixed picture of the U.S. labor market:
Initial Claims
Current Level: 213,000
Change: Decreased by 6,000
Comparison to Estimates: Lower than the expected 220,000
Significance: Reached the lowest level since April
This unexpected drop in initial claims suggests continued resilience in the job market, with fewer people filing for unemployment benefits than anticipated.
Continuing Claims
Trend: Rose to a 3-year high
Caveat: Seasonal adjustments may have influenced this increase
The rise in continuing claims representing ongoing unemployment benefit recipients could indicate challenges for job seekers in finding new employment. However, the impact of seasonal adjustments on this figure should be considered when interpreting its significance.
The Philadelphia Fed Manufacturing Index for November:
Headline index: Unexpectedly fell into contraction
Future expectations: Rose to highest level since June 2021
This divergence suggests current manufacturing challenges but improved optimism for future growth.
No Lagged Effects
The Federal Reserve's rate cut approach may stem from concerns about the "long and variable lags" of their monetary tightening from March 2022 to August 2024. However, the economy continues to show resilience, with no clear evidence of these lagged effects materializing.
Economic Indicators
The Index of Leading Economic Indicators (LEI) declined again in October, but its reliability as a recession predictor has been questionable since its peak in December 2021. While it may be useful for forecasting manufacturing sector recessions, it appears less suited for the service-oriented U.S. economy.
Stock Market Performance
The S&P 500, one of the LEI's most accurate components, has reached new record highs since early 2024, indicating positive economic sentiment.
Coincident Economic Indicators
The Index of Coincident Economic Indicators has consistently risen to new record highs, contrasting with the LEI's downward trend and suggesting ongoing economic strength.
Interest Rates and Economic Surprises
The increase in U.S. Treasury yields since the Fed began lowering the federal funds rate (FFR) on September 18 correlates with the upturn in the Citigroup Economic Surprise Index. This suggests that the neutral FFR might be closer to the 5.25%-5.50% range than the current 4.50%-4.75% range.
Diverging Views
Market Perspective: The current FFR may provide additional economic stimulus, as it could be below the neutral rate.
Fed's Stance: Federal Reserve officials maintain that the FFR remains restrictive and should be gradually lowered to around 2.90%.
This divergence in views highlights the ongoing debate about the appropriate monetary policy stance in the face of conflicting economic signals.
The Index of Leading Economic Indicators (LEI)
The Index of Leading Economic Indicators (LEI) may be misleading for the US economy due to several factors:
Manufacturing Bias
The LEI tends to give heavier weight to the economy's manufacturing sector without adequately recognizing the increasing importance of services. This bias can lead to a skewed representation of the overall economic health, especially considering that services drive approximately 70% of the U.S. economy.
Post-Pandemic Anomalies
The unusual impact of COVID-19 on the economy has likely resulted in data inconsistencies, policy distortions, and cycle anomalies, which have affected the LEI components. These unique circumstances make it challenging for the LEI to predict economic trends in the post-pandemic environment accurately.
Divergence from Other Indicators
While the LEI has been signaling a potential recession, other economic indicators paint a different picture:
The S&P 500 has been reaching new record highs since early 2024
The Index of Coincident Economic Indicators (CEI) has consistently risen to new record highs, contradicting the LEI's downward trend.
Historical Reliability vs. Current Performance
Although the LEI has historically been a reliable predictor of recessions, its recent performance has been questionable:
The LEI has decreased for 23 consecutive months through January 2024, yet the U.S. economy has delivered impressive economic growth over the past 12 months
The average lead time between the LEI falling 5% and the start of a recession has historically been around three months, but the Index dropped 5% in November 2022 without a recession materializing.
Composition and Weighting Issues
The LEI's composition may not adequately reflect the current structure of the U.S. economy:
It may need to be adjusted to give more weight to the services sector, which plays a dominant role in the modern U.S. economy
The index's components and their weightings may not have been updated to reflect recent economic shifts and trends
In conclusion, while the LEI remains a valuable tool for economic forecasting, its current methodology and composition may lead to misleading signals about the U.S. economy's health and direction. As the economy evolves, particularly in the wake of the pandemic, the LEI may require recalibration to maintain its predictive power.
(3) US Stock Market Seasonality: Riding the Bull in November, December, and January
The final quarter of the calendar year has historically been the best quarter of the SP 500. December, April, and November are traditionally the three best months of a calendar year.
On average, the 2-monthly period from November until December is also the best bi-monthly period of a calendar year.
Except for 2016, when Donald Trump won the presidential elections for the first time, price action has been positive since 2013.

Over the past ten years, the average performance of the S&P 500 during November and December was approximately 4.41%.

Data shows that during election years, the S&P 500 has historically underperformed in the September-to-early-November period compared to non-election years.
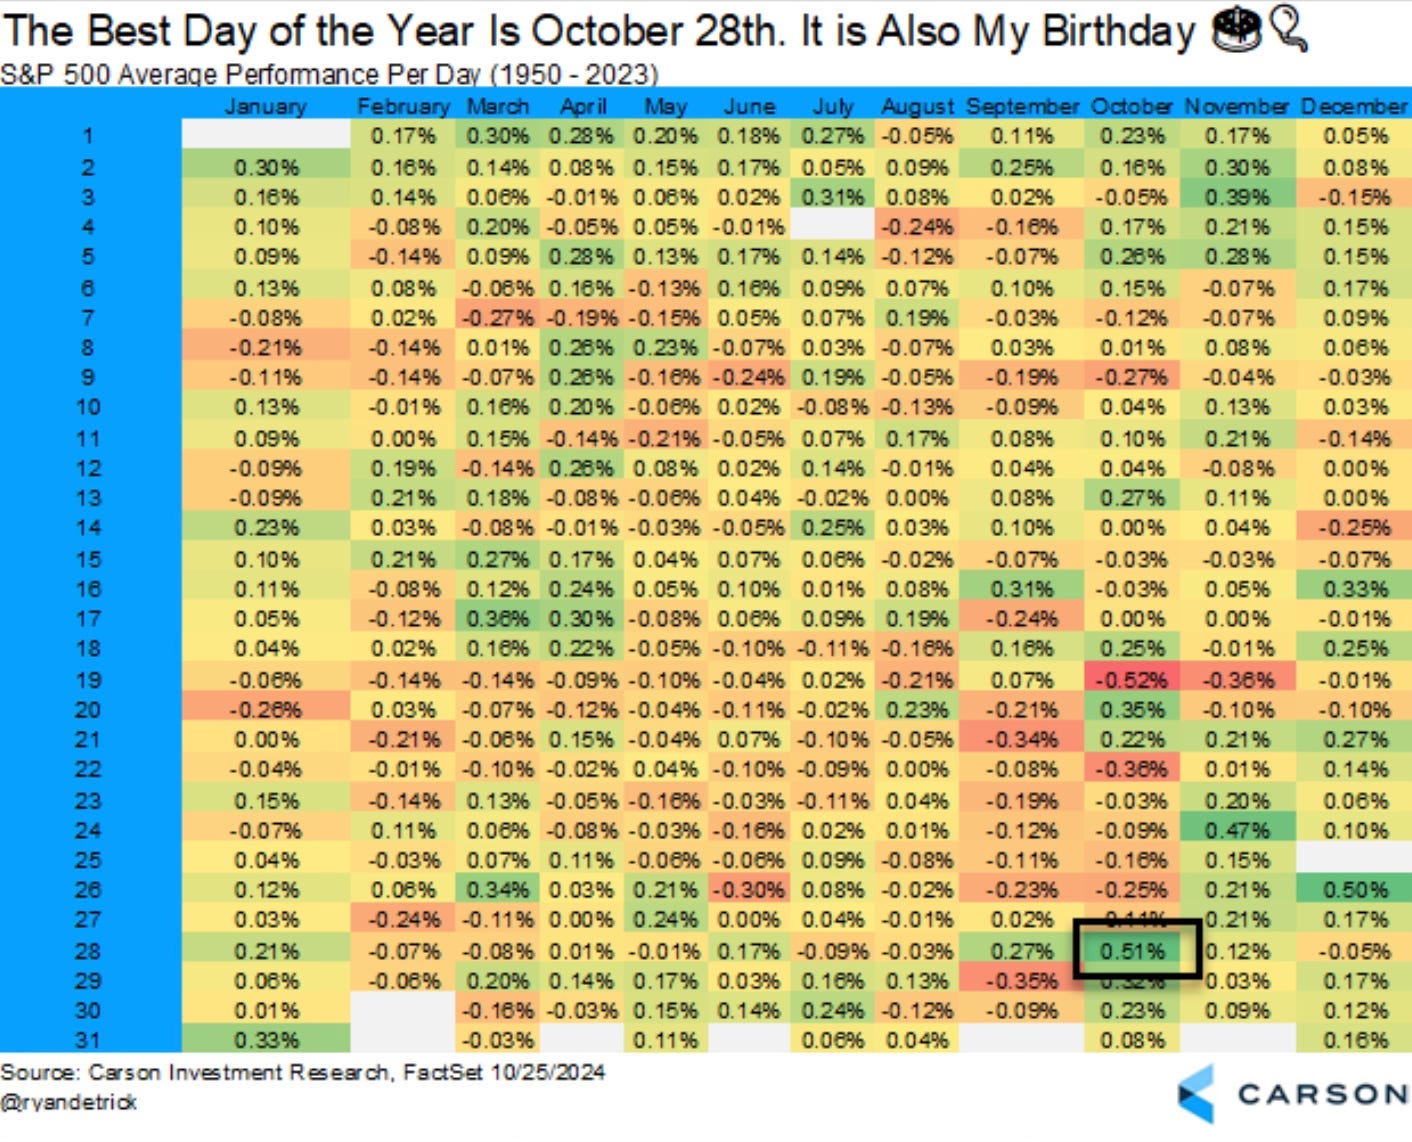
The table above is from Carson Investment Research.
I like to remember the final two months of 2023, which saw the underperformance of the Mag-7 stocks reversing in early 2024.
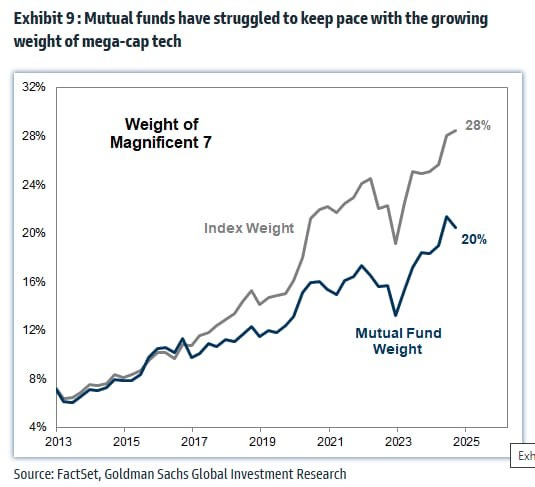
Right now, mutual funds are drastically underweight the Mag 7. TheMag-7 have become the index Drag-7.
While it’s been predominantly a cost-cutting and efficiency gains story to date, more companies are participating in the earnings recovery as ~60% of S&P 500 companies have positive EPS growth today versus ~50% in 1Q 2023.

I expect the broadening trend in earnings growth to continue. The market may have anticipated this, which may continue until the end of January 2025.
After that period, I see a return of Mag 7/ megacap tech market leadership.
(4) Long-Term Analysis: Nasdaq 100, Semiconductors, Nvidia And More
Please turn to section one for the analysis.
Keep reading with a 7-day free trial
Subscribe to Closelooknet to keep reading this post and get 7 days of free access to the full post archives.