


Two Tales of Stock Market Action: Traditional vs Digital Assets
Crypto Crazy, Dollar Strength And The Calming Effect of DOGE

Salve, cari subscripti!
Thank you for reading this week's edition of Closelook@Global Stock Markets, dated November 23, 2024 👋. The next edition will be published on November 30, 2024.
The next edition of Closelook@US Stock Markets will be published on November 24, 2024.
The next edition of Closelook@Hypergrowth will be published on November 27, 2024,
A Closelook At This Edition
This Week's Action: Global Stocks - Two Tales of Stock Market Action
Global Stock Markets: Comprehensive Overview Of 36 Global Stock Markets
Crypto Crazy: Bitcoin, Ethereum and Solana
The ETF Portfolio: Continued Rebalancing
This Week's ETF Spotlight: VanEck Sustainable Future of Food UCITS
Knowledge Corner: MAHA
Upcoming Transactions: More Rebalancing Ahead
Final Words: The DOGE Initiative May Calm Bond Vigilantes

(1) This Week's Action: Global Stocks In Retreat Mode
The week spanning from Monday, November 18 to Friday, November 22, 2024, displayed two different sets of stock market behavior.
While global stock markets outside the US were flat on aggregate on the week, the US stock markets headed north. While crypto assets move significantly higher, the Mag-7 turned into the Drag-7.

Strongest Performers
Bitcoin led with the highest YTD return of 134.4% and the most substantial weekly gain of 10.3%
The Nasdaq shows the best YTD performance among traditional indices at 26.6%. but was the worst of the four leading stock market indices, adding only 1.7 %.
Oil had a strong week with a 6.3% gain but remains slightly negative for the year.
Traditional Indices
All major stock indices show positive weekly gains, ranging from 1.7% to 4.5%.
The Russell 2000 outperformed other stock indices for the week with a 4.5% gai.n.
The 10-year Treasury yield remained stable at 4.41% with minimal YTD. movement.
The Dow Jones Global Index rose about 1 % for the week. The index could not break above the downward-sloping upper consolidation channel trendline.

Price action still looks like a consolidation/correction inside a bull market to me and not like the start of a reversal and a significant top. The long-term bull channel is still intact.

The index has lost about 0.5 percent in the month. It has been down 2 percent in the last 30 days. It is up 14,07 % YTD and 20,49 % in a 52-week perspective.

While the odds still favor another rate cut in December in the US, continued US rate cuts in 2025 seem more unlikely. The ECB will likely cut rates more aggressively.
This should continue to strengthen the US Dollar and keep the downward pressure on the Euro.

Looking at the global stock markets, ex, the US, the situation worsens. The chart above shows the Vanguard FTSE All World Ex US ETF. The ETF failed to make an ATH in 2024.
It has declined much more than the Dow Jones Global Index, which is heavily skewed toward the US. The index is sitting on a significant support level. If it breaks, further declines may lie ahead.
(2) Global Stock Markets: Comprehensive Overview Of 36 Global Stock Markets
Argentina, Hungary, Taiwan, Germany (DAX), and India continue to be the five best-performing global stock markets outside the US, taking a one-year perspective.
The table below displays 36 global stock markets. Laggards are Russia, Mexico, South Korea, France, and the German and Dutch midcap indices.
While the German DAX is among the top global performers, the MDAX and SDAX are among the worst. DAX companies derive +70 percent of their revenue internationally. They are not an indication of the state of the German economy. MDAX and SDAX companies do most of their business inside Germany/EU. They are an accurate indication of the state of the German economy.
Until two weeks ago, the Russian RTS Index was the only index in the red and the worst-performing one globally, taking a 1-year perspective. As of 22 November 2024, Mexico, South Korea, and France have turned negative, too.

Taking a 5-day view, 17 of the 36 stock markets covered traded up for the week. Argentina was the best performer, followed by South Korea. Russia cratered.

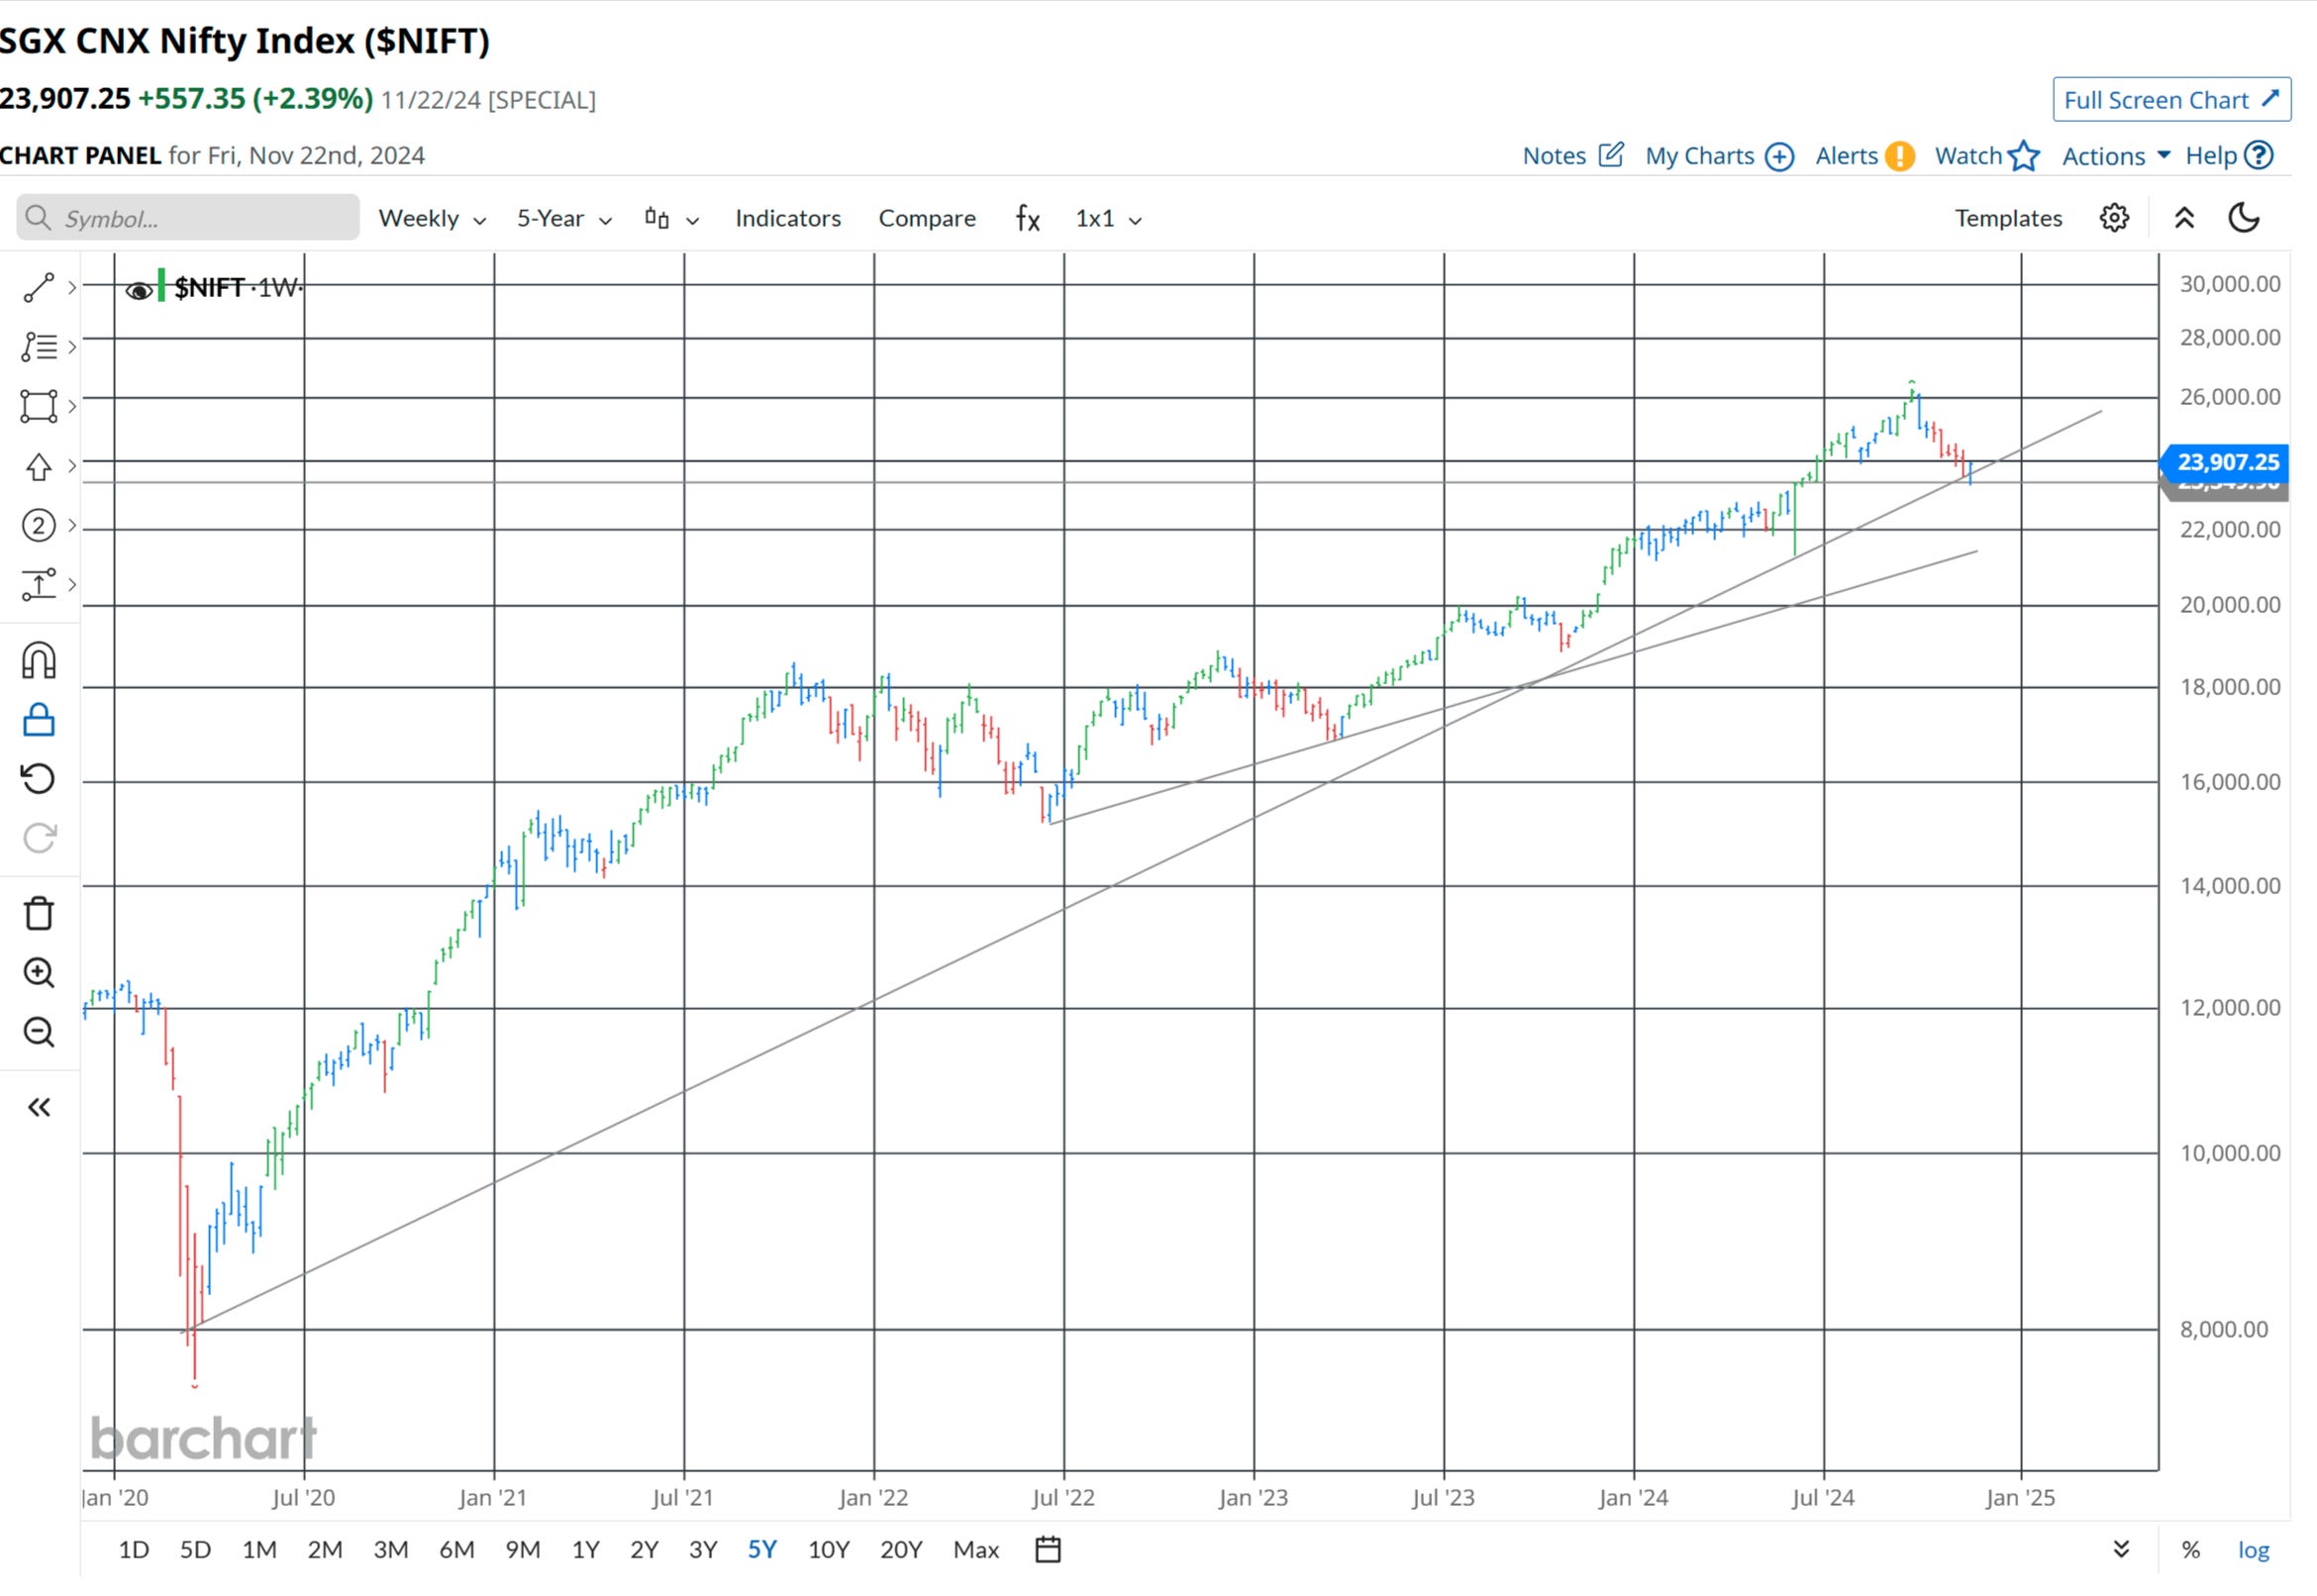
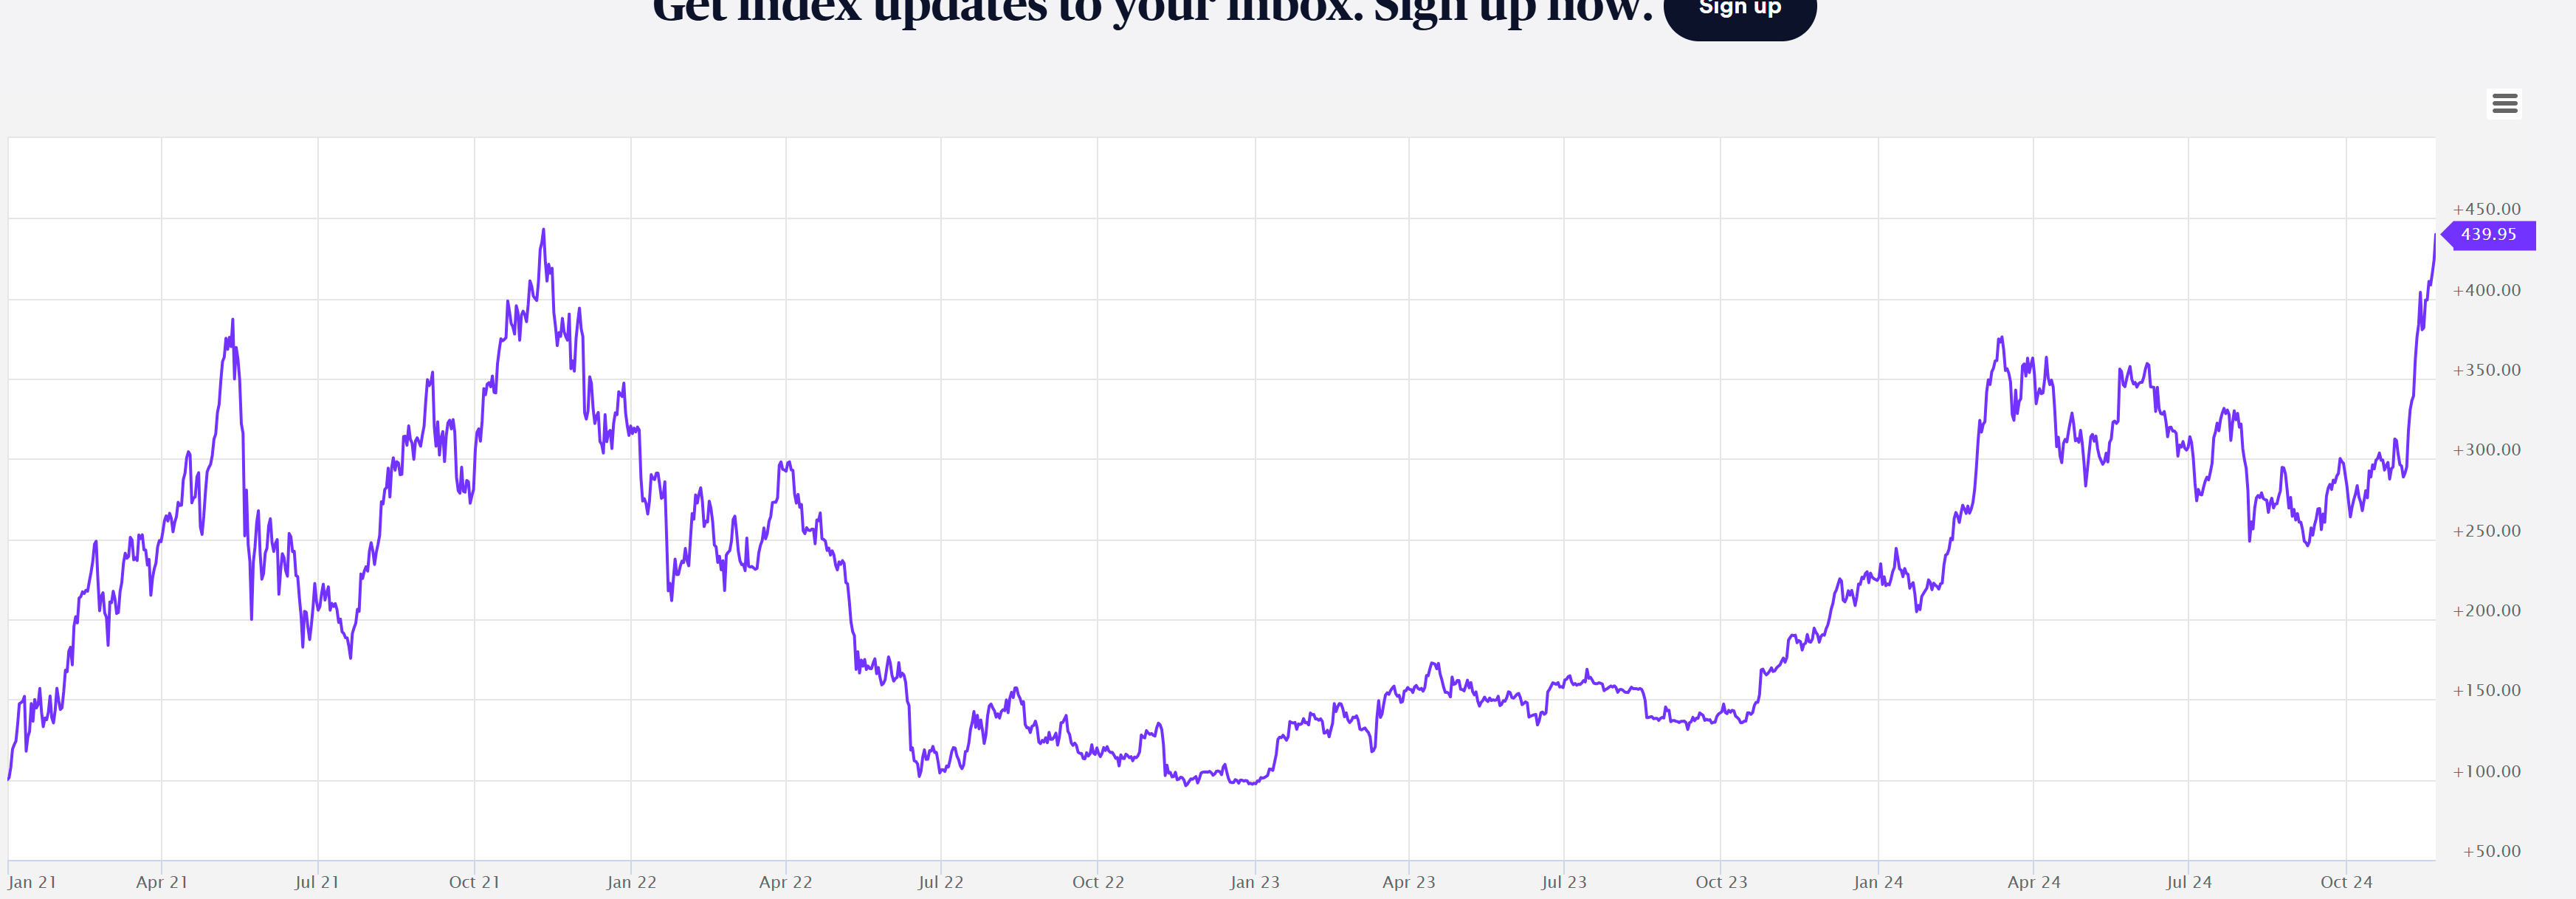
The Nifty Fifty Index in India was up 1.5 % on the week. The Equal Weight Nifty Fifty index is sitting on a critical support level. I expect the market to move higher from here and resume its uptrend.

The same applies to the Nifty Fifty Index itself. I see India as a net beneficiary of the Trump policy.
The Euro Stoxx 50 Index was unable to reach above the consolidation trendline. It sits on the lower bull trend line, which has been developing since the start of the bull in late 2022.
A break below the trendline may indicate that a temporary end of the European bull market is ahead.

The same applies to the MSCI Eurozone ETF. It failed to make an ATH. The ETF has already broken below that bull trend line.

The same also applies to the German MDAX index. A move toward the 26000 to 25000 level seems likely.

The SDAX is negative YTD now. 13300 is a critical support level. A break below the level seems likely to me. The downtrend is firmly intact.

The ASEAN stock markets have moved in the opposite direction to the European markets recently. I expect this to continue. I also see the ASEAN countries as net beneficiaries of the Trump policy shift.

Various ASEAN indices hit the upper trend line and consolidated in the past weeks. The consolidation should be in its final stage or may have ended already. I expect the bull market to resume shortly/or have resumed already.

In contrast to the various ASEAN countries, Japan has trended down since the summer of 2024. I doubt there will be another attempt to reach the 42000 level on the Nikkei index soon.

Chart-wise, the UK stock market looks better to me now. The long-term bullish trend is still intact.

We may see a year-end rally as the consolidation/correction looks relatively complete.
(3) Crazy Crypto
Bitcoin, Ether, and Solana have risen sharply since the Trump election victory. I believe that in the short-term they are due for a pause.
(1) Bitcoin
Bitcoin may have completed five waves up. A move above 100.000 USD may be the short-term top.

I do not see the top of the fifth wave as the top of the Bitcoin bull market, as I expect an extended impulse wave with nine legs to unfold.
I sold all my Microstrategy positions above 500 USD. Options on the IBIT BItcoin fund are a better way to embark on a leveraged Bitcoin trade, in my opinion. I only trade selling options - selling puts to play a move up and selling cally to play a move down.

Ether is still 700 points below the spring 2024 peak. I expect some catch-up to occur. But Ether looks vulnerable compared with Solana.

Solana moved past the spring 2024 highs and reached above the old ATH. I expect Solana to move close to the 300 USD level soon.
The Coin 50 index is close to its ATH. When Bitcoin consolidates, several altcoins should begin to move up considerably.

I am currently monitoring which altcoins may be suitable for a risk-on investment.
(4) The ETF Portfolio: Continued Rebalancing
From now on, I will detail the performance of the four investor portfolios in a weekly post in the Daily Brief section of the newsletter.
This will soon entail real-time trading signals. The next update will be on Monday, November 25.

The ETF portfolio developed nicely during the week. I made three transactions.

I added to the Solana position. I rebought the INQQ Internet India ETF and I bought an initial position in the VanEck Sustainable Future of Food UCITS - a beneficiary of the Trump MAHA policy.

The two Indian ETFs and the Roundhill Weight Loss ETF are the biggest losers. The Bitcoin ETF has been the best performer.
Selling the Gold Miners ETF and replacing it with a Solana ETP proved to be correct. The S&P Capital markets ETF, a recent buy, developed nicely. The Russel Midcap Pure Growth ETF is up more than 15 percent since I bought it.
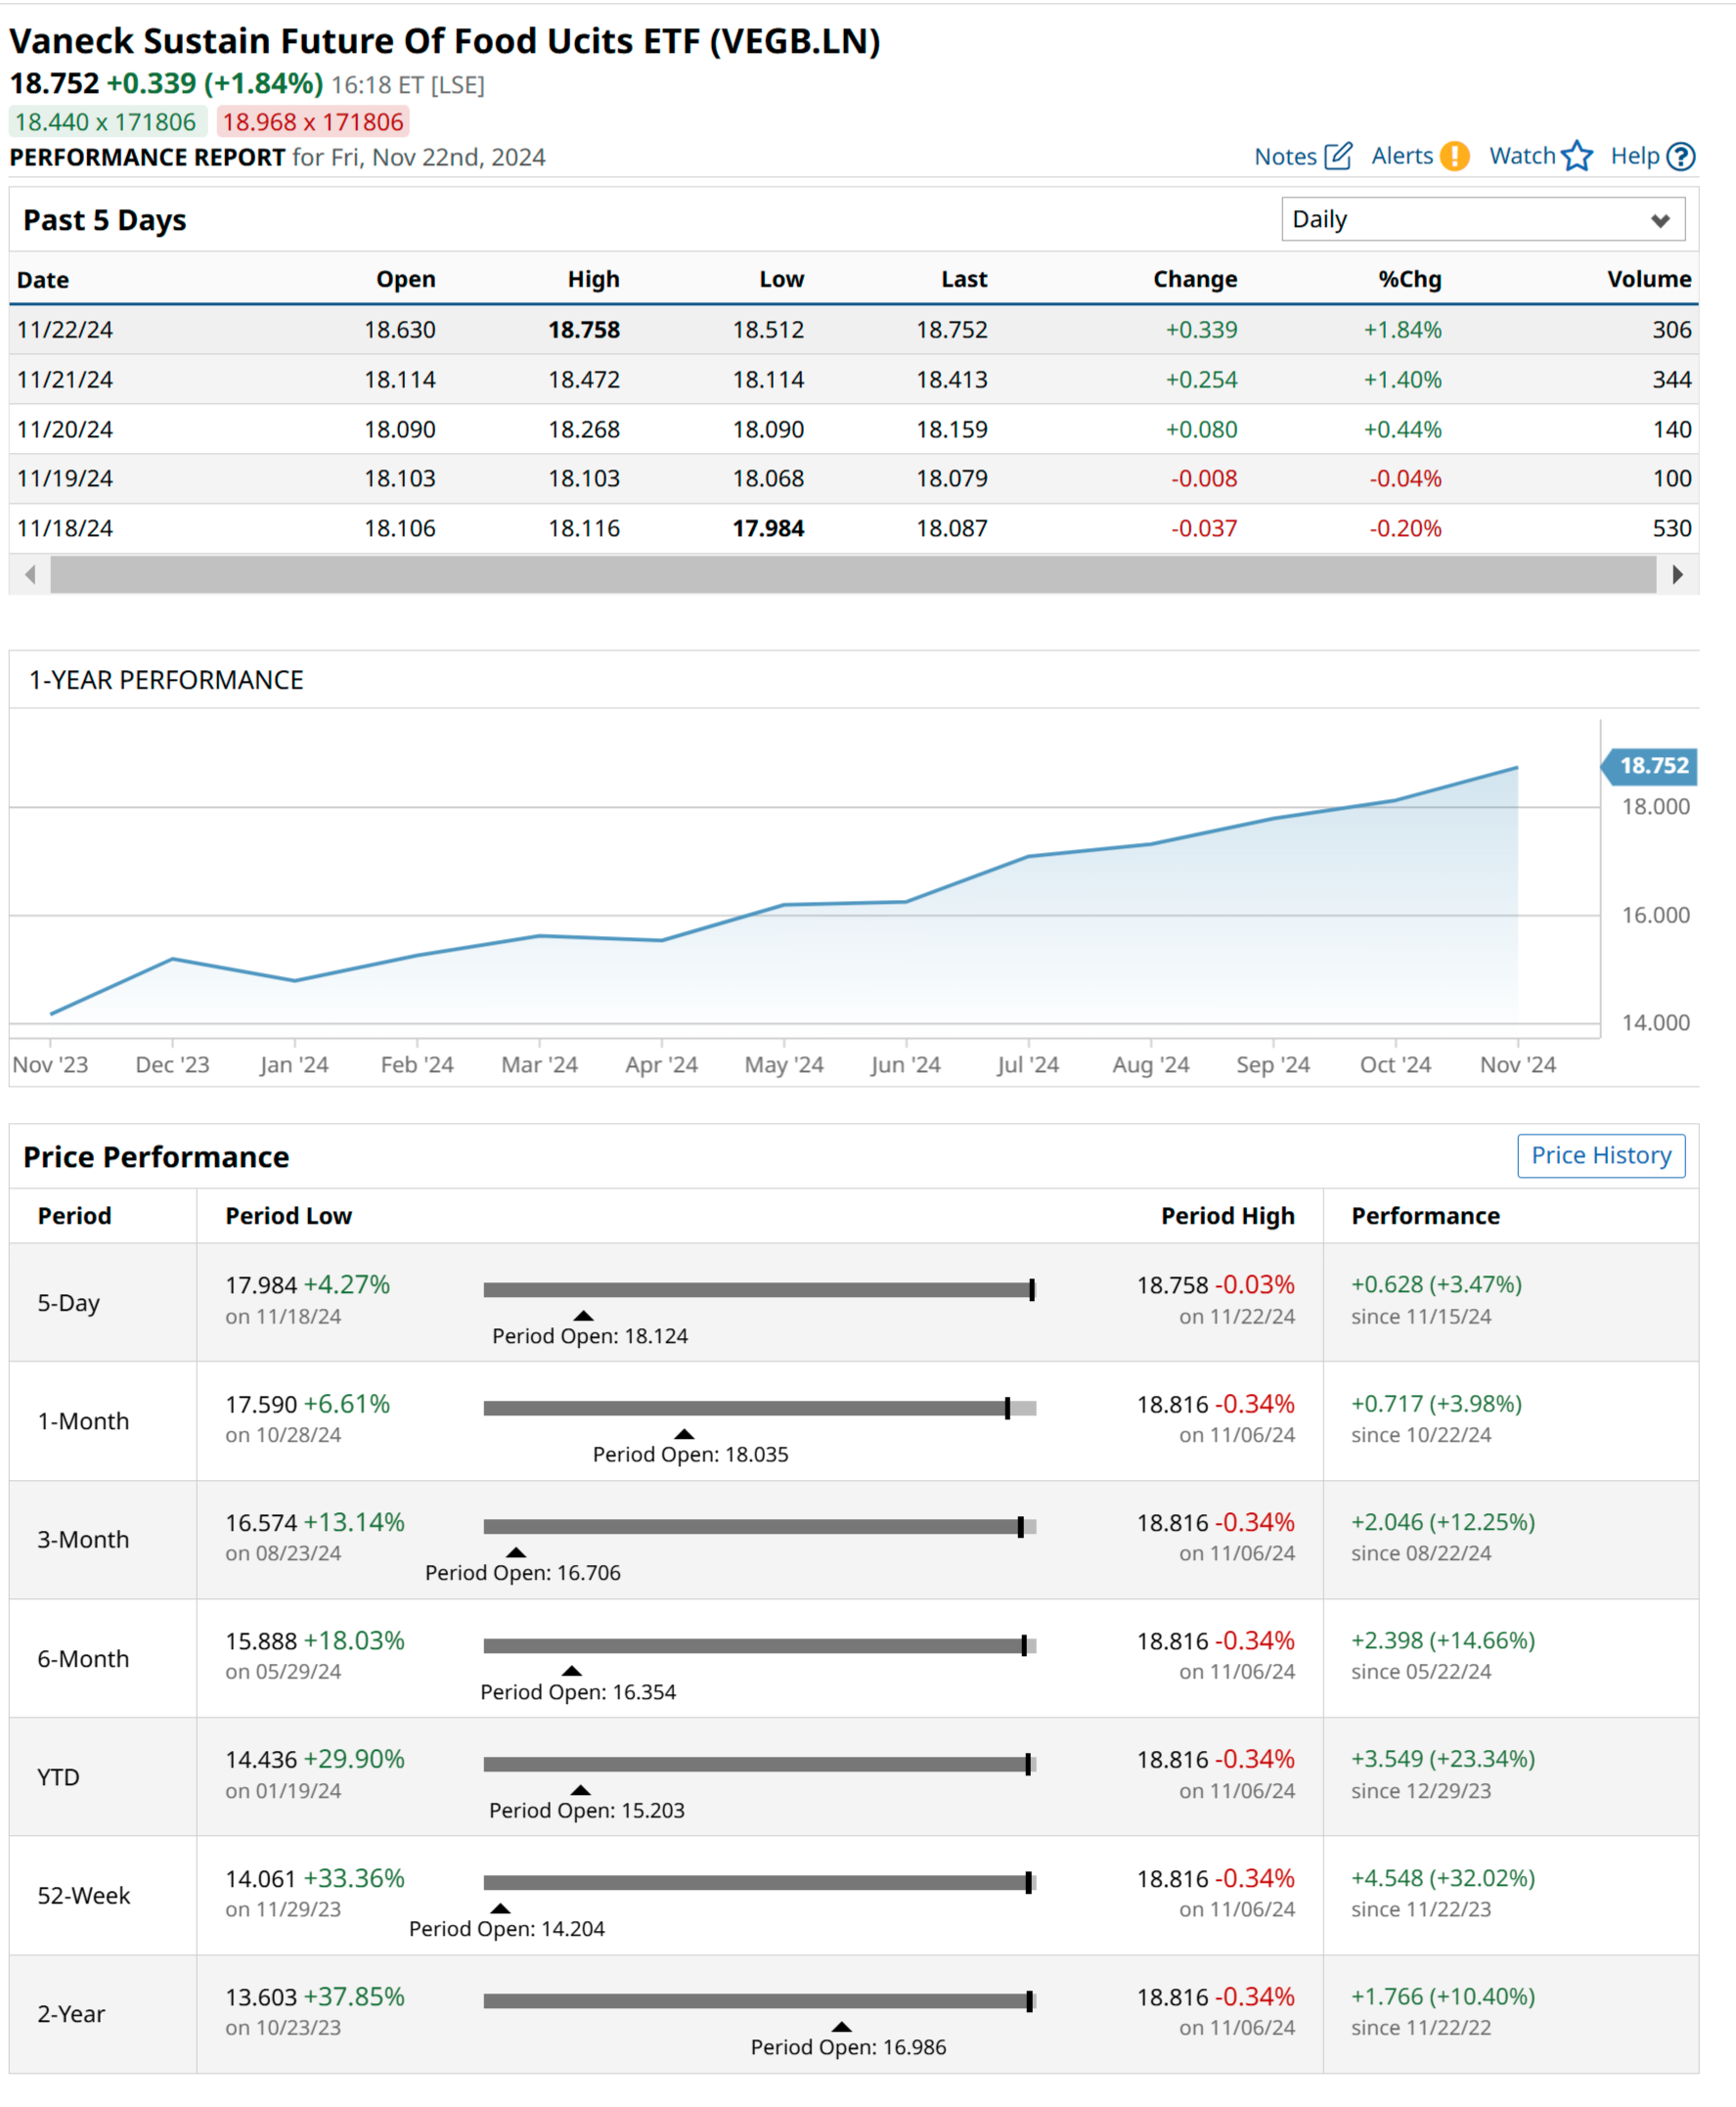
(5) This Week's ETF Spotlight: VanEck Sustainable Future of Food UCITS
The VanEck Sustainable Future of Food UCITS ETF focuses on companies pioneering sustainable food solutions.
The VanEck Sustainable Future of Food UCITS ETF tracks the MVIS Global Future of Food ESG Index. The MVIS Global Future of Food ESG Index provides access to companies worldwide engaged in developing and producing sustainable food.
The included securities are filtered based on ESG (Environmental, Social, and Governance) criteria.
The ETF's total expense ratio (TER) is 0.45% annually. The VanEck Sustainable Future of Food UCITS ETF is the only ETF that replicates the MVIS Global Future of Food ESG Index. The ETF replicates the index's performance through full replication (purchasing all the components of the index). Dividend income within the ETF is accumulated (reinvested into the ETF).

The VanEck Sustainable Future of Food UCITS ETF is a small ETF with a fund volume of €5 million. The ETF was launched in Ireland on June 24, 2022.
The ETF's sector allocation is as follows:
Consumer Staples: 69.67%
Basic Materials: 27.36%
Industrials: 2.02%
Consumer Discretionary: 0.37%
Other: 0.58%
As of September 30, 2024, the ETF's top 10 holdings and their respective weightings are:

These top 10 holdings constitute approximately 52.78% of the ETF's total portfolio. Geographically, the ETF is diversified across several countries:
United States: 53.77%
Switzerland: 8.63%
China: 5.82%
Ireland: 4.94%
Other: 26.84%
Keep reading with a 7-day free trial
Subscribe to Closelooknet to keep reading this post and get 7 days of free access to the full post archives.