

Strange Brew: Puzzling Patterns in Nasdaq, Nasdaq 100, SP 500, DJIA, R2K
Technical Analysis of the US Stock Market

(1) What's the buzz?
Strange currents are stirring in the market cauldron this week. Our technical analysis, including a deep dive into Elliott Wave patterns, has uncovered a peculiar mix of signals across the Nasdaq, the Nasdaq 100, the S&P 500, the Dow, and the Russell 2000.

The buzz on Wall Street is all about the enigmatic brew of bullish resilience and growing bearish undercurrents. Unexpected wave formations and perplexing price actions that don't fit the usual mold may unfold.
Sifting through the tea leaves of charts and indicators, the market's sending mixed messages but with a distinctly bearish aftertaste. This strange brew might just be signaling a shift in the financial winds.
(2) Nasdaq
The Nasdaq reached an ATH before weaker-than-expected tech results dragged the index down. The longer-term bull trend is still intact.
The preferred Elliott wave count is depicted below. In this scenario, we are in wave 5, moving to new ATHs by the end of the year before a more significant consolidation sets in during 2025.

The alternative count is that we will have a more complex consolidation first, leading to a wave B double top now, followed by a market decline until after the election.
I have come to like this scenario more than a few weeks ago. The stock market has displayed unusual strength in September and October, leaving little room for substantially more upside this year unless we see a surprisingly good earnings season.

This does not seem to play out, given the earnings prints from companies such as Eli Lilly, Meta, AMD, and Microsoft.

(3) Nasdaq 100
The Nasdaq 100 has failed yet to make a new ATH. This is a bearish divergence. The longer-term bull trend is still intact.
The index showed renewed strength in the last days, led by the Top 30 Nasdaq 100 index. Given the disappointing earnings prints, this uptrend may have ended.

The Nasdaq 100 Tech Sector has lagged the broader Nasdaq 100 index recently. It is still approximately five percent below its summer peak. This is another bearish divergence.

The Nasdaq 100 Ex Tech Sector has led the recent rise in the Nasdaq 100. The uptrend may have ended, too, as an essential trendline has just been broken to the downside.

The Nasdaq 100 Equal Weight Index has confirmed the bearish divergence and may have recorded a double-top. However, the longer-term trend is fully intact.

(4) SP 500
The SP 500 has recently been more robust than the Nasdaq. The longer-term uptrend is intact. A move below 5750 to 5770 would be harmful to the market.

The SP 500 Info Tech sector has been the most robust SP 500 sector in the past year. It may be in its final wave up before a more extensive consolidation sets in. This aligns with the wave 5 scenario on the Nasdaq.
All 11 SP 500 sectors have seen gains in the past 52 weeks. Energy is the laggard, while SP Info Tech, Communication Services, and Financials have been the three best-performing sectors.
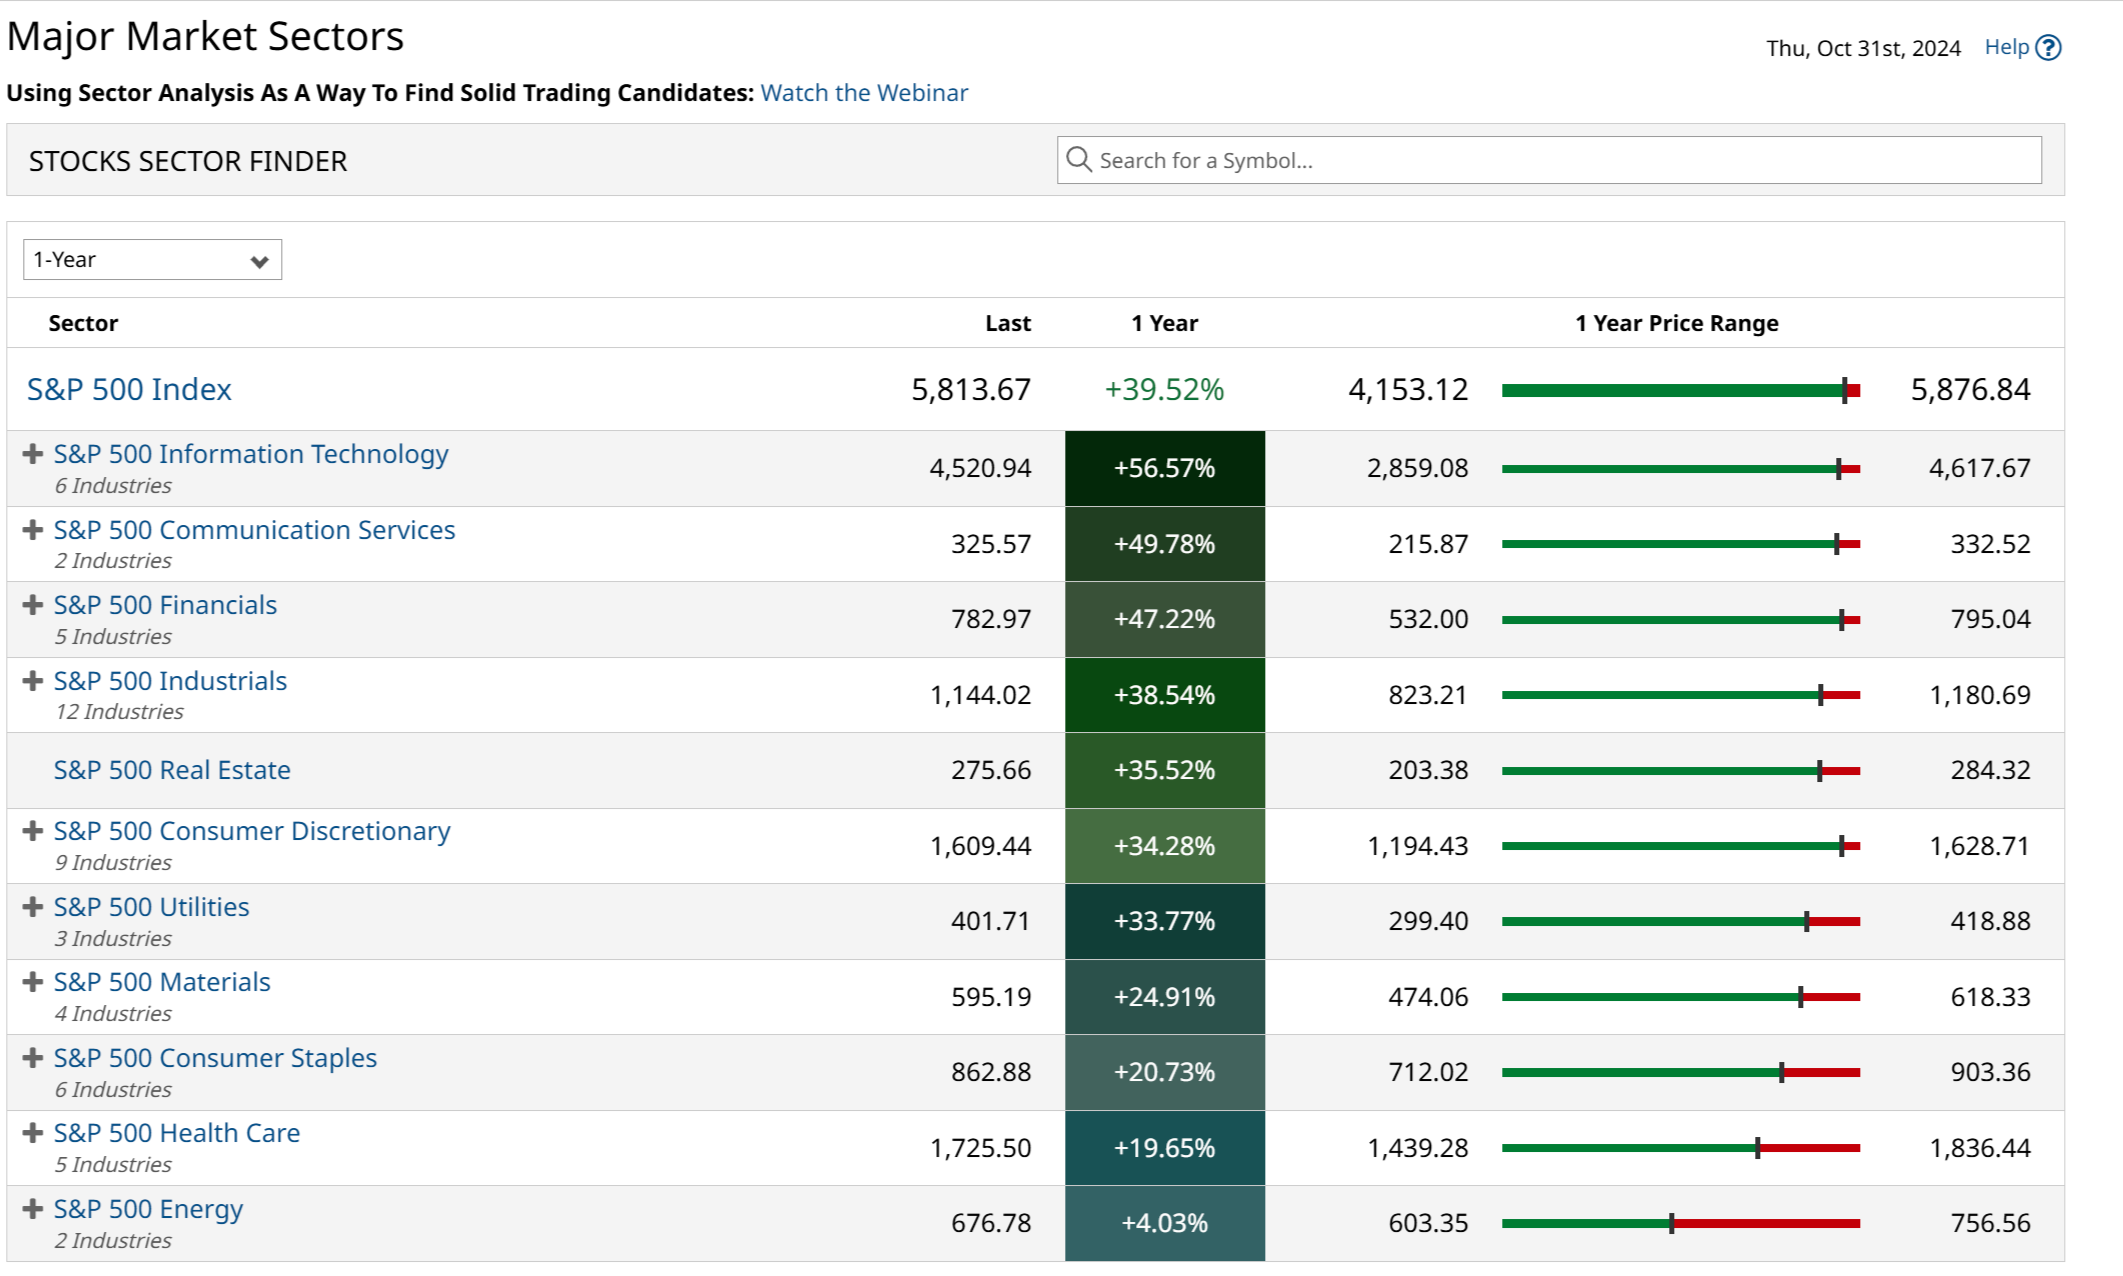
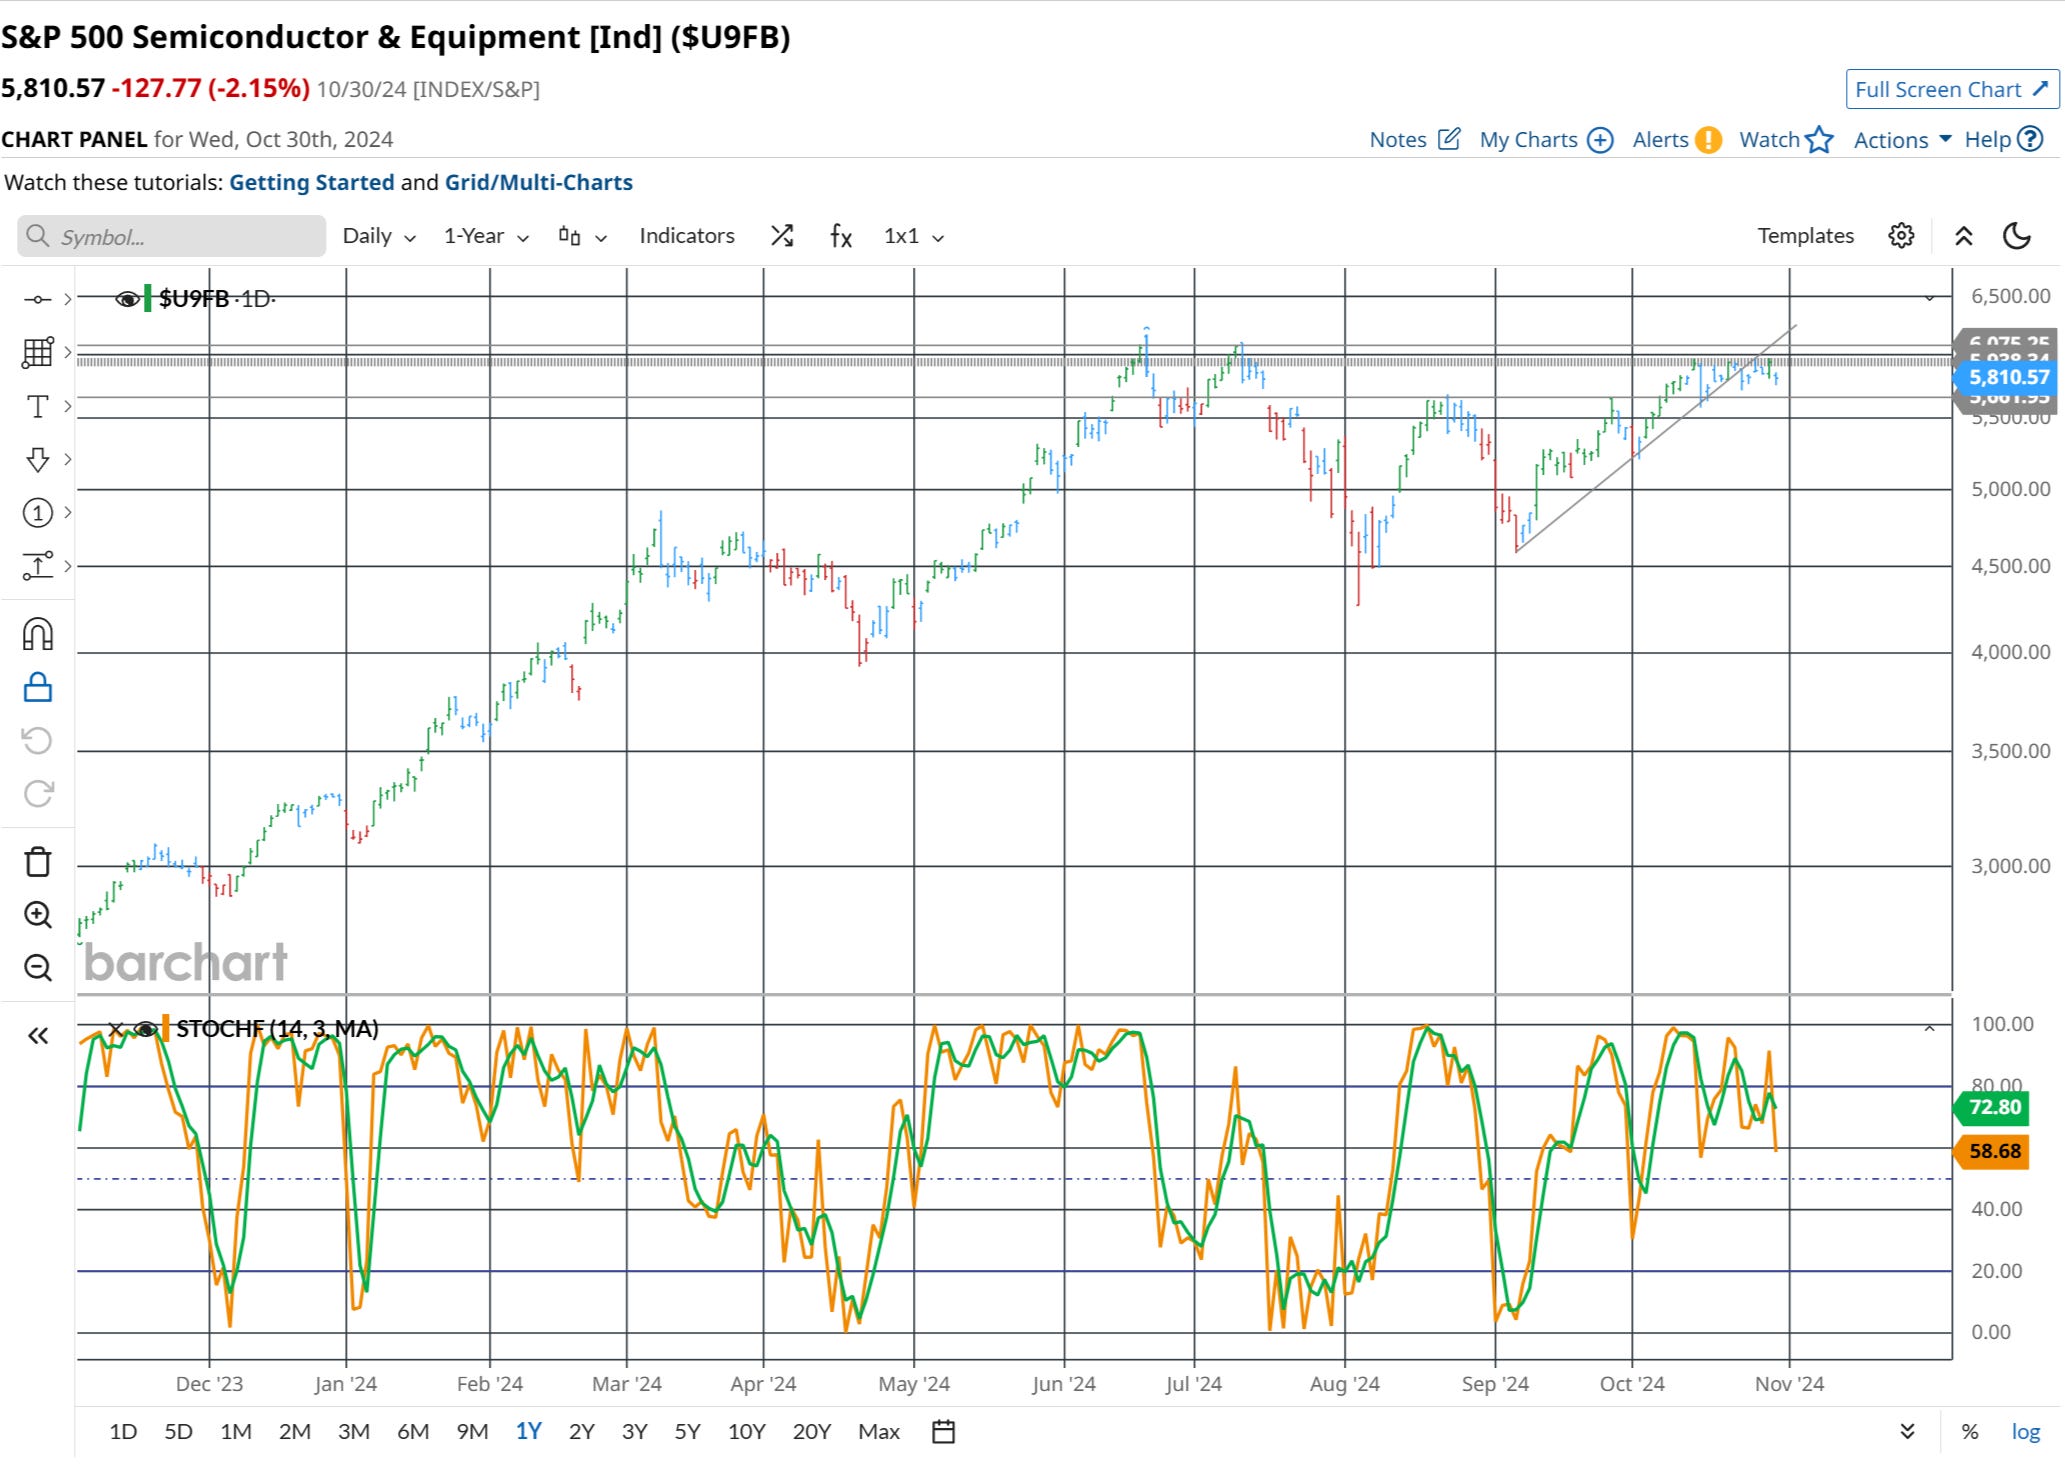
Inside the SP 500 Info Tech Sector, the Semiconductor & Equipment Subsector has been the best performer, gaining more than 125 %.

The subsector has shown a negative divergence, too, as it failed to reach a new ATH moving above the early summer peak.
Using the semiconductor subsector similarly to the Dow Jones Transportation to the Dow Jones Industrial Average in Dow Theory would point to declining Nasdaq prices unless a new top can be seen soon.
(5) DJIA, DJT and DJU
The DJIA lagged the Nasdaq and the SP 500 for most of the time in 2024. However, it has been the best performer recently.

The Dow Jones Transportation Index has failed to confirm the recent ATH of the DJIA. It ran into a heavy multi-year resistance zone. Since summer 2021, the index has moved sideways.

Because utilities enjoy particular interest from the AI play, I like to use the TLT ETF for the interest-sensitive part of the analysis.
The longer-term downtrend (uptrend in yields) is intact. The medium-term uptrend (downtrend in yields) hinges on the support level at which the TLT ETF is currently trading.

It looks as if yields on the 10-year would soon trade between 4.25 and 4.50 percent.
(6) R2K
The Russel 2000 has still not broken through the heavy resistance zone at which it failed in the summer. The medium-term uptrend is fully intact.

The current resistance zone dates back to the year 2021. It is a crucial multi-year resistance zone.

Keep reading with a 7-day free trial
Subscribe to Closelooknet to keep reading this post and get 7 days of free access to the full post archives.